 Previous Topic
Getting Started with Logi Report Designer v18.1
There is a series of steps or tasks that you need to take before you can start using Logi Report Designer. This topic guides you through the tracks of action for getting started with Designer.
- Reporting Development Environment Setup and Start-up
- Create a Catalog and Set Up Data Connections
- Create Data Resources for Reports
- Start Creating Reports
- Publish and Export Reports
Reporting Development Environment Setup and Start-up
Before installing Designer, you need to check your system to make sure that it meets all the basic requirements. Designer can run on Windows, macOS, UNIX, and Linux platforms. You can use different methods to install and run Designer on each platform.
Installing and Running Designer on Windows
Installing and Running Designer on macOS
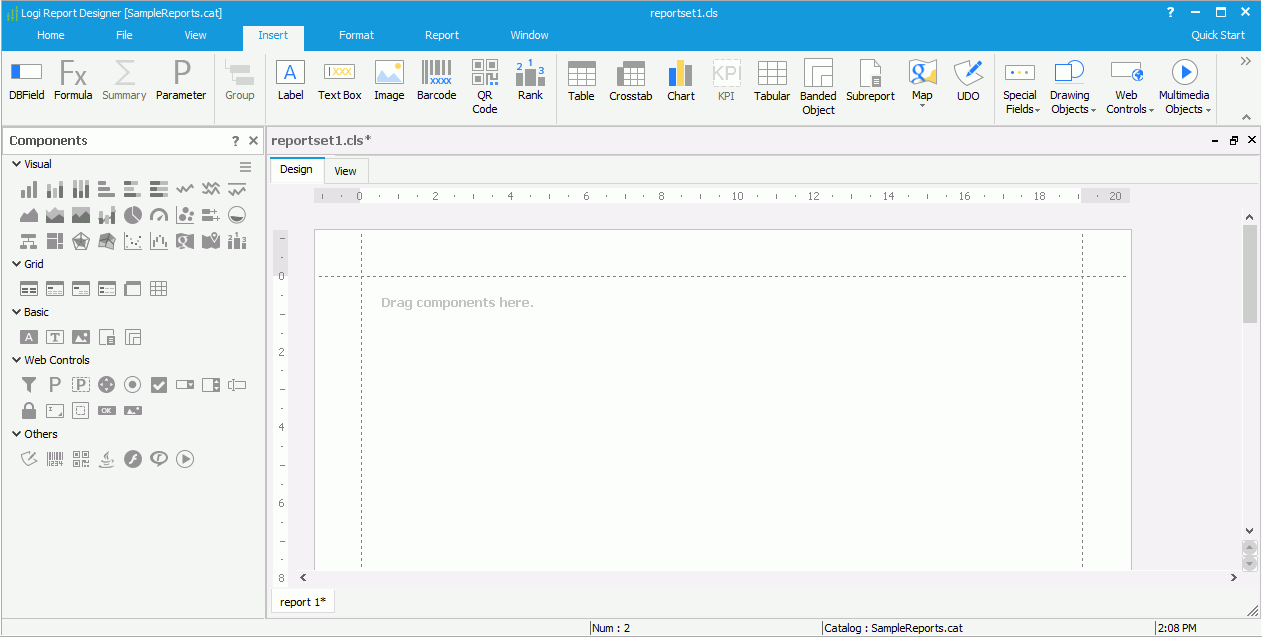
After you start Designer, it is recommended that you get a general idea about its window elements. The Designer development environment consists of the following parts:
Create a Catalog and Set Up Data Connections
Before you can create reports in Designer, you need to first create a catalog and set up connections in the catalog to enable Designer to retrieve data from your data sources for the reports. You can use most of the current mainstream databases which support JDBC drivers, and XML data sources, JSON data sources, and Elasticsearch data sources.
Creating a Catalog
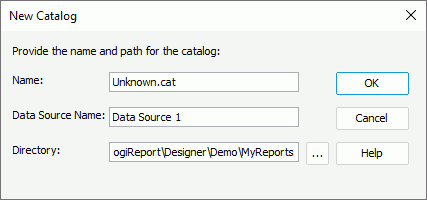
- Select File > New Catalog. Designer displays the New Catalog dialog box.
Designer may prompt you to save changes to the current open catalog. You can open only one catalog at a time.
- In the Name text box, type the name for the catalog. The name must include the extension (.cat or .cat.xml).
- In the Data Source Name text box, type the name for the data source to be created along with the catalog (when you create a catalog, you create a data source in the catalog at the same time by default). You can include spaces in the name but do not use special characters.
- In the Directory text box, specify the path to save the catalog. You can also select the ellipsis
 to browse to and select the directory in which to create the catalog. The directory you specify must not already contain a catalog file.
 - Select OK to create the catalog.
Designer displays the Catalog Manager. You can then set up connections to connect the catalog data source with your databases.
Saving a Catalog
To save a catalog, select Save Catalog on the Catalog Manager toolbar. You have specified the type, name, and location when you created the catalog.
Via specific JDBC drivers, you can create JDBC connections in a catalog to connect with different relational databases. You can also connect to relational databases stored in Hive data warehouses via JDBC connections.
JDBC Databases Designer Supports
You can create JSON connections in a catalog to transform JSON data sources to relational data.
You can create JSON connections in a catalog to transform JSON data sources to relational data.
Web services provide a standard means of inter-operating between different software applications, running on a variety of platforms and/or frameworks. It is a way to connect to a remote application and request data directly from the application without going to a DBMS. Designer supports SOAP Web Services defined by WSDL 1.1 or WSDL 2.0 as data sources. You can add SOAP Web Service data sources to a catalog by importing WSDL files.
You can create MongoDB connections in a catalog to connect to MongoDB databases and transform the collections in the databases to relational schemas.
You can create Elasticsearch connections in a catalog to connect to Elasticsearch data sources and transform the schemas in the data sources to relational schemas.
Through the UDS API, developer users can also access data from an external data source, such as a text file or Excel file, which is not stored in a database or when there is no JDBC driver available.
Create Data Resources for Reports
After you set up the connections in a catalog, Designer is now able to get data from your databases. You can use the data to create queries, which are the data resources you can use to create page reports in Designer. You can use queries to build various professional reports, and view, change, and analyze data in different ways.
Business views are the data resources for creating reports in both Designer and Server. They provide report designers and end users with an easily understood business-oriented view of their data.
You can use parameters to provide filters to pass to queries to dynamically control the report content at runtime.
Formulas are objects that are computed at runtime, which enable you to manipulate field data by performing calculations on them. They control the data to display, and can even create new data that is not directly available from the database.
Summaries are a special kind of formulas. You can use summaries to generate aggregations for your data using aggregate functions such as Count, Average, Sum, and Standard Deviation.
Start Creating Reports
After connecting a catalog to your database and creating the necessary data resources such as queries, business views, formulas, and summaries in the catalog, you can use the data resources to design your reports. Logi Report supports three types of reports, Page Report, Web Report, and Library Component.
Components are the objects that you can place in a report. Logi Report provides a full set of components that enable you to present and control the report data and presentation in a wide variety of ways.
Logi Report classifies the components into the following categories:
- Visual: Chart, Map, KPI, and Rank
- Grid: Table, Crosstab, and Tabular
- Basic: Label, Text Box, Image, Subreport, and Banded Object
- Web controls: Filter Control, Parameter Control, Parameter Form Control, Navigation Control, Expand/Collapse Group, Radio Button, Checkbox, Drop-down List, List, Text Field, Password, Text Area, Button, Image Button, and Form
- Fields: DBField, Formula Field, Summary Field, and Parameter Field
- Drawing objects: Line, Arc, Box, Oval, and Round Box
- Special fields: Print Date, Print Time, Fetch Date, Fetch Time, Record Number, and many more
- Others: UDO, Barcode, and Multimedia Object (including Applet, RealMedia, and Windows Media)
You can use either the Insert menu tab or the Components panel to add components into a report.
- To create a component using the Insert menu tab, place the mouse pointer at the location where you want to add the component in the report, then select the option representing the component on the menu tab.
- To create a component using the Components panel, drag the icon representing the component from the panel to the desired location in the report design area.
Designer then adds the component in the report or displays the corresponding dialog box for you to define the component.
Inserting Crosstabs in a Report
Inserting Banded Objects in a Report
Inserting Geographic Maps in a Report
Creating Shape Maps in a Report
Using Parameter Fields in a Report
Using Formula Fields in a Report
Using Summary Fields in a Report
Using Special Fields in a Report
Using Web Controls in a Report
Using Multimedia Objects in a Report
Using Drawing Objects in a Report
Publish and Export Reports
Designer, as a report design tool, enables you to publish your resources from it to a production environment. When you publish a resource such as a report template, Designer publishes all of the referenced report templates and additional resources such as images although they are not visible. This ensures that images and linked reports are available at runtime.
As you develop reports in Designer, you can print the report result or export the result to a file so that you can review the result at any time or share with others.
Exporting Report Result to Mail
Export Report Result to Logi Report Result
Exporting Report Result to HTML
Exporting Report Result to PDF
Exporting Report Result to Excel
Exporting Report Result to Text
Exporting Report Result to RTF
Exporting Report Result to XML
 Back to top