 Previous Topic
Inserting a Banded Object
You can create banded objects in a report easily using the banded object wizard, however, the wizard varies with the data resource type used for the banded object: business view or query resource. This topic introduces how you can create a banded object with the banded object wizard using different data resource.
You can insert banded objects in the report areas listed in Component Placement. When you insert a banded object into another banded object in a page report, you can set up data container link between the banded object and its parent.
 A page report can use either query resources or business views, which is determined by the Create Using Business View option at the time when you create the page report. Once defined, all the data components in the page report can only use the specified data resource type.
This topic contains the following sections:
- Creating a Banded Object Based on a Business View
- Creating a Banded Object Based on a Query Resource
Creating a Banded Object Based on a Business View
- Position the mouse pointer at the destination where you want to insert the banded object.
- Select Insert > Banded Object or Home > Insert > Banded Object.
Designer displays the Create Banded Object dialog box, which contains a set of screens for helping you to define a banded object easily. You can use the Back and Next buttons or select the screen name on the screen navigation bar to switch between the screens.
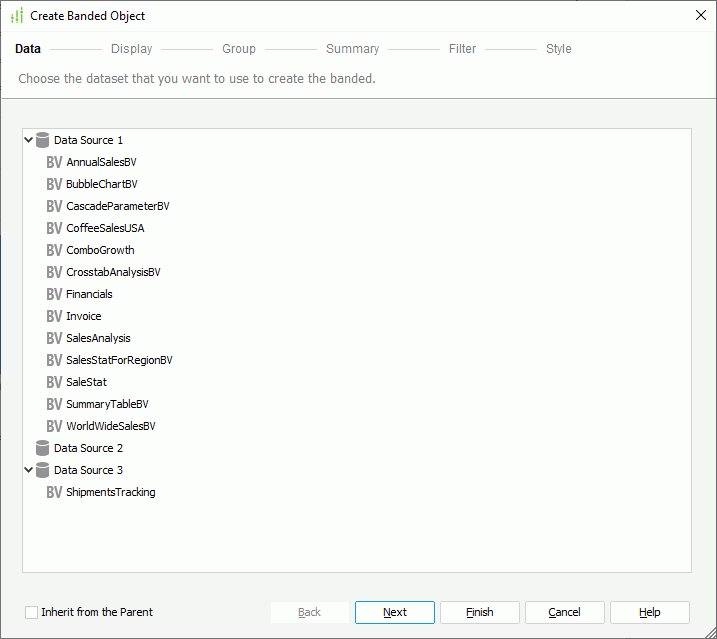
- In the Data screen, select the business view in the current catalog using which to create the banded object.
If you have specified to insert the banded object into any of the following panels in a banded object: banded header panel, banded footer panel, group header panel, or group footer panel, Designer displays the Inherit from the Parent option. Select it if you want the banded object to inherit the business view that its parent uses.
- In the Display screen, add data fields to display as detail fields in the banded object.
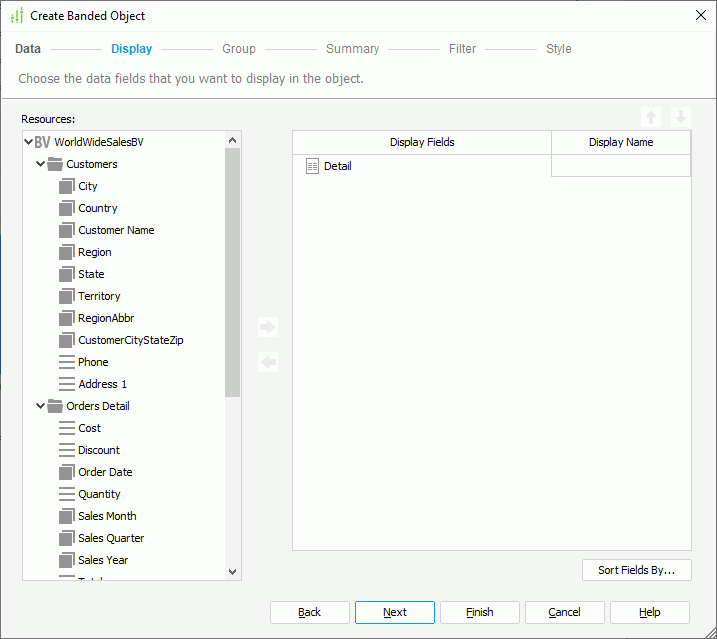
The Resources box lists the group objects
 and detail objects
  in the specified business view, and the dynamic formulas used as Group
  and dynamic formulas used as Detail
  that you have created for the business view in the current report. You can use them as detail fields in the banded object.
To add a detail field, select a field in the Resources box and select Add
 or drag the field from the Resources box to the right box. You can use Move Up
  and Move Down
  to adjust the display order of the detail fields in the banded object. By default, Designer uses the display names of the added fields to label the corresponding detail columns; to edit the label text for a detail column, select in the Display Name text box and type a new one; if you want to automatically map the label text to the dynamic display name of the field at runtime, select Auto Map Field Name in the text box. You can also select Sort Fields By to specify in which manner to sort the detail values the same as you do for a table.
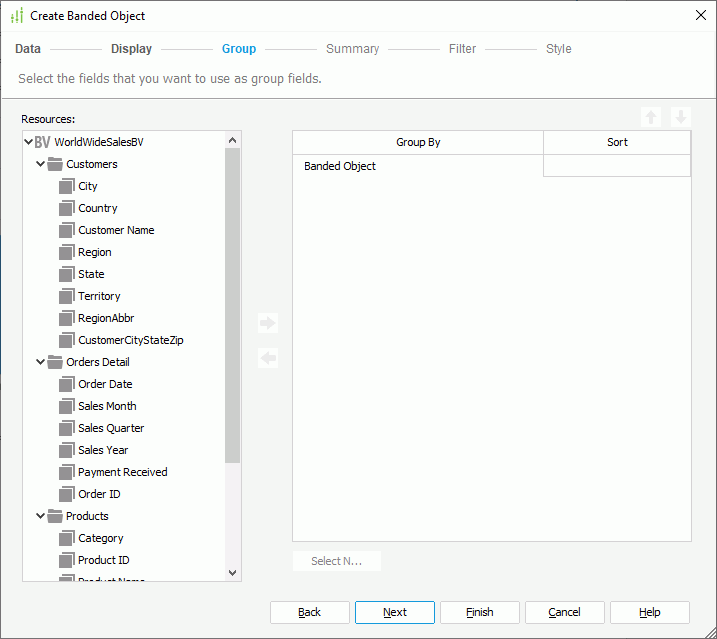
 - In the Group screen, specify the criteria for grouping data in the banded object the same as you do for a table.
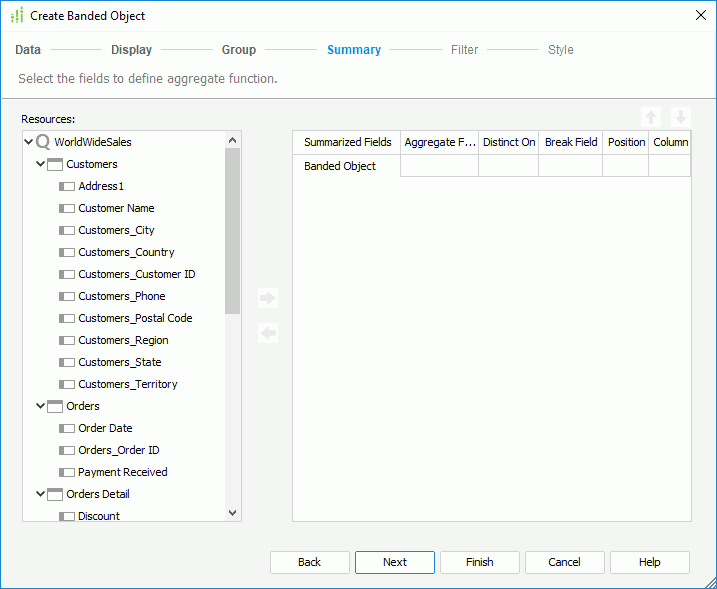
- In the Summary screen, add summaries to calculate data in the banded object.
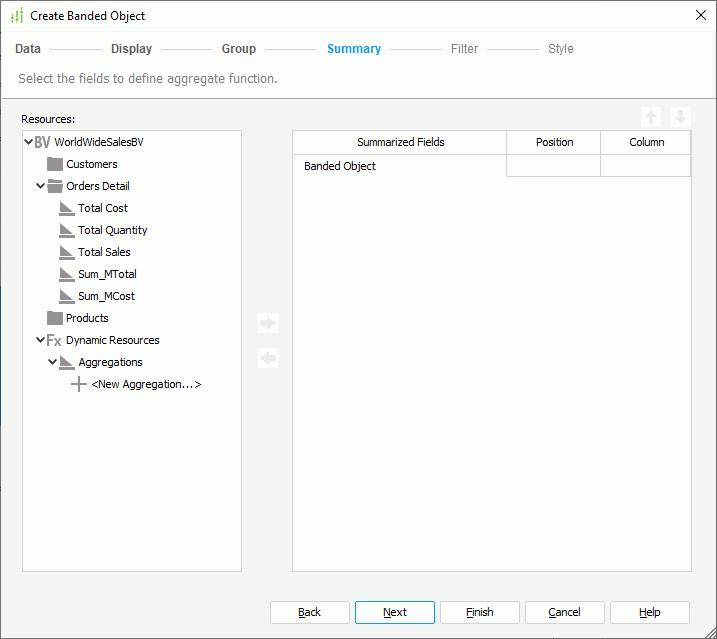
The Resources box lists the aggregation objects
 in the specified business view, and the dynamic aggregations that you have created for the business view in the current report. You can add them as summaries to calculate data in the banded object.
To add a summary, in the right box, select the group to which you want to apply the summary (if you select Banded Object, it is based on the whole business view), then select a field in the Resources box and select Add
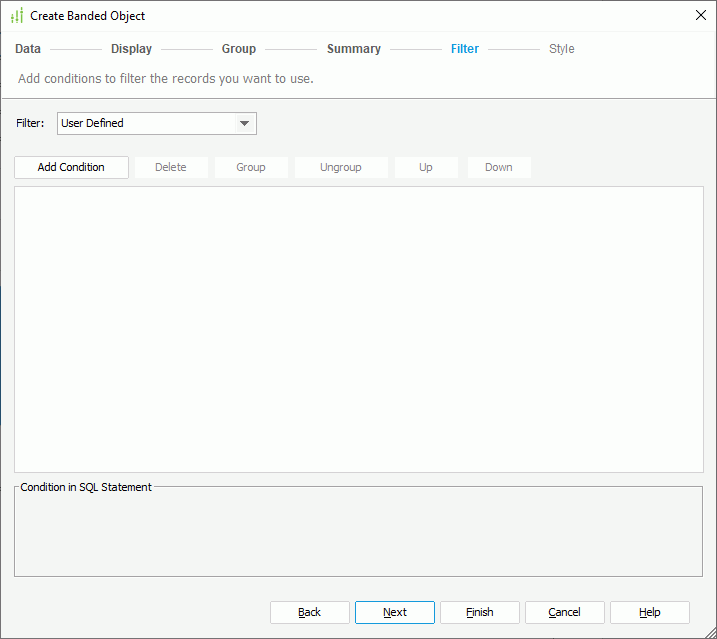
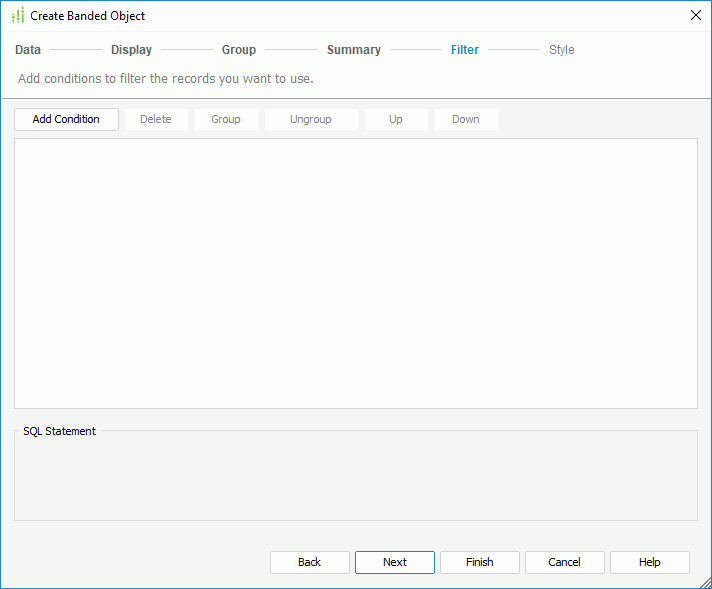
or drag the field from the Resources box to the right box. You can add several summaries for any group level and use Move Up and Move Down to adjust the display order of the summaries in the current group or move a summary to another group. Designer determines the position of the summaries in the banded object by the Position and Column options and you cannot change it: Designer places a summary added for the Banded Object level in the intersection of the banded footer panel and the first two detail columns with its name label which is the display name of the field used for the summary by default; Designer places a summary added for a specific group in the intersection of the group's footer panel and the first two detail columns with its name label. - In the Filter screen, apply a filter to reduce the data to display in the banded object. You can select a predefined filter of the specified business view from the Filter drop-down list to apply, or select User Defined in the list to define a new filter as required.
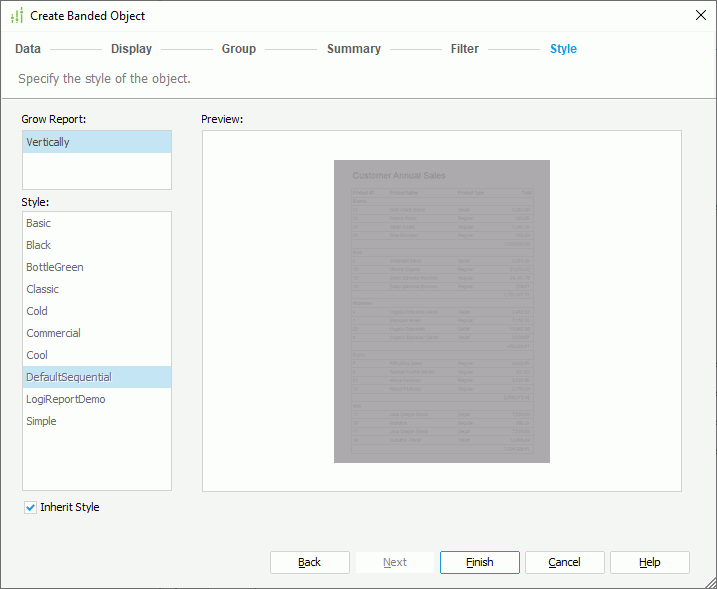
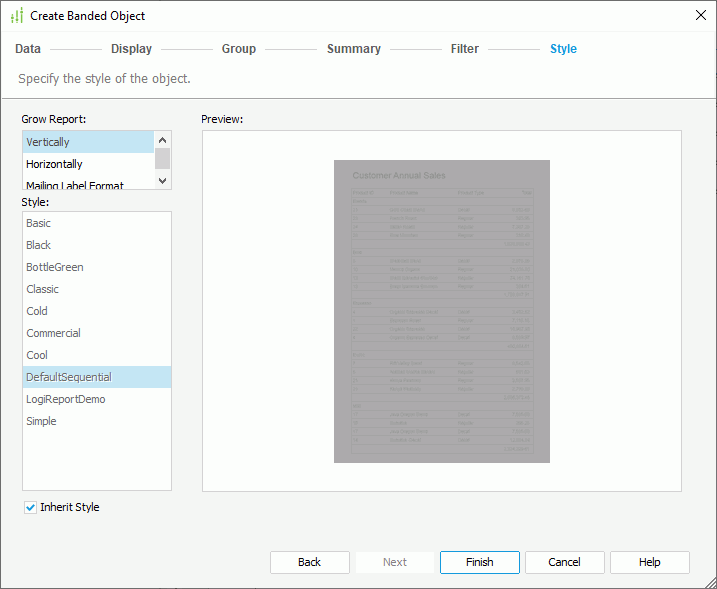
- In the Style screen, specify the style of the banded object.
If you have specified to insert the banded object into another banded object, the banded object inherits its parent's style by default; to apply another style to the banded object, clear Inherit Style and select the required style from the Style box.
- Select Finish to insert the banded object.
If you have selected a panel in another banded object as the banded object destination, after finishing the dialog box, you need to select in the destination once again in order to insert the banded object there.
Besides using the wizard, you can also drag a blank banded object to the report.
- From the Components panel, drag the Banded Object icon
 in the Basic category to a destination in the report which allows the insertion of a banded object. Designer creates a blank banded object.
 - You can use all the business views the current report applies as the data resource of the banded object. To locate a business view, select the data component that uses the business view. Designer then displays the business view in the Data panel.
- Drag the required view elements and dynamic resources from the Data panel into the banded panels.
 Back to top
Creating a Banded Object Based on a Query Resource
- Position the mouse pointer at the destination where you want to insert the banded object.
- Select Insert > Banded Object or Home > Insert > Banded Object.
Designer displays the Create Banded Object dialog box, which contains a set of screens for helping you define a banded object easily. You can use the Back and Next buttons or select the screen name on the screen navigation bar to switch between the screens.
- In the Data screen, select the data resource in the current catalog using which to create the banded object.
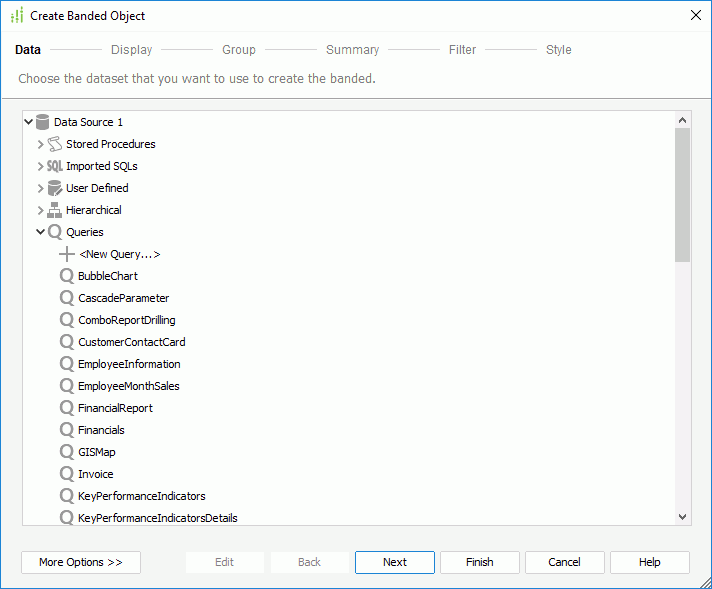
If the predefined data resources are not what you want, you can select the first item in the corresponding resource node to create one in the current catalog to use. When you select a query, you can select Edit to modify the query. Designer then automatically creates a dataset based on the selected data resource in the page report.
If you want to use an existing dataset in the current page report to create the banded object, select More Options and then:
- Select Existing Dataset and select a dataset. You can select Edit to modify the specified dataset in the Dataset Editor dialog box, or select <New Dataset...> to create a dataset in the page report to use. It is always better to use an existing dataset rather than create a new one. Even when the two datasets are based on the same query, Logi Report Engine still runs the query separately for each dataset.
- If you have specified to insert the banded object into any of the following panels in a banded object: banded header panel, banded footer panel, group header panel, or group footer panel, Designer enables the Current Dataset radio button. Select it if you want the banded object to inherit the dataset from its parent.
- In the Display screen, add data fields to display as detail fields in the banded object.
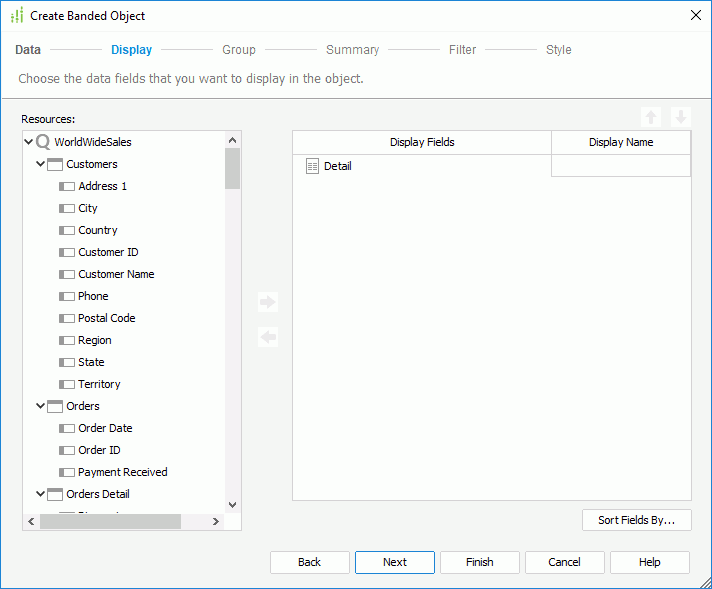
The Resources box lists all the DBFields in the specified data resource, and the formulas and parameters that are valid to these DBFields in the current catalog. You can use them as detail fields in the banded object.
To add a detail field, select a field in the Resources box and select Add
or drag the field from the box to the right box. You can use Move Up and Move Down to adjust the display order of the detail fields in the banded object. By default, Designer applies the display names of the added fields to label the corresponding detail columns; to edit the label for a detail column, select in the Display Name text box and type a new name. You can also select Sort Fields By to specify in which manner to sort the detail values the same as you do for a table. - In the Group screen, specify the criteria for grouping the data in the banded object the same as you do for a table.
- In the Summary screen, add summaries to calculate data in the banded object.
The Resources box lists all the DBFields in the specified data resource, and the formulas that are valid to these DBFields in the current catalog. You can create summaries based on these fields in the banded object.
To add a summary, in the right box, select the group to which you want to apply the summary (if you select Banded Object, the summary is based on the whole dataset), select a field in the Resources box and select Add
or drag the field from the Resources box to the right box, then specify the aggregate function as required. If you select DistinctSum, you should select the ellipsis  in the Distinct On text box to specify one or more fields according to whose unique values to calculate DistinctSum using the Select Fields dialog box. From the Position and Column drop-down lists, select the position of the summary: when you add a summary for the Banded Object level, you can place it and its name label in the intersection of the banded footer panel (Footer)/banded header panel (Header) and the first two detail columns (Detail)/a new summary column (Summary); for a summary added to a specific group, you can place it and its name label in the intersection of the group footer panel/group header panel and the first two detail columns/a new summary column. You can add several summaries for any group level and use Move Up and Move Down to adjust the display order of the summaries in the current group or move a summary to another group. After the banded object is created, Designer automatically gives the summaries proper name labels to help you clarify the meaning of the numbers.
Designer adds the summaries created from the Summary screen to the current catalog as static summaries even when identical summaries already exist. Therefore, it is better not to create summaries here, instead you can add dynamic summaries to the catalog and drag the dynamic summaries to the banded object after you have created it.
- In the Filter screen, add filter conditions based on the fields that you have added to the banded object to reduce the data. Select here for how to define a filter.
- In the Style screen, specify the layout and style of the banded object.
In the Grow Report box, specify whether to create a vertical banded object, horizontal banded object, or mailing label banded object. In the Style box, select the style of the banded object. If you have specified to insert the banded object into another banded object, the banded object inherits its parent's style by default; to apply another style to the banded object, clear Inherit Style and select the required style from the Style box.
- Select Finish to insert the banded object.
If you have selected a panel in another banded object as the banded object destination, after finishing the dialog box, you need to select in the destination once again in order to insert the banded object there.
Besides using the wizard, you can also drag a blank banded object to the report.
- From the Components panel, drag the Banded Object icon in the Basic category to a destination in the report which allows the insertion of a banded object. Designer creates a blank banded object.
- In the Data panel, select the dataset in the current page report with which you want to create the banded object from the dataset drop-down list, or select <Choose Data from...> from the list to create a new a dataset for the banded object.
- Drag the required data fields in the specified dataset from the Data panel into the banded panels.
- When you insert a banded object using wizard,
- Designer indents the groups in the banded object according to the Customize group indent option setting in the Options dialog box.
- By default, Designer aligns all the summaries horizontally in the banded object. If you want to align them vertically, select Align summaries vertically in the Options dialog box in advance.
- When you insert an object whose height is determined at runtime into the banded page footer panel (BPF), for example a subreport, but do not set the height of the panel high enough to hold this object, the object might get overlapped with the ones that are in the panel which is above the BPF panel at runtime.