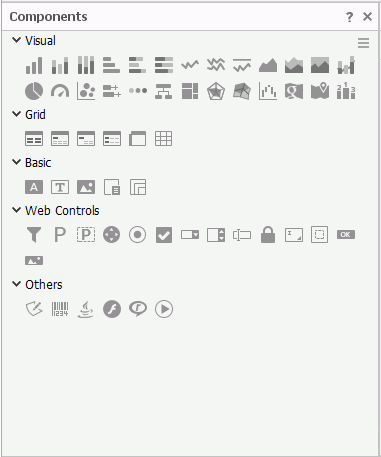
Components Panel
The Components panel lists all the components that you can insert into a report (to display the panel, select Home/View > Components). This topic introduces the usage of the panel generally.

Designer classifies the components in the panel as follows and they vary according to different report types.
- Visual: chart, map, KPI, rank
- Grid: table, crosstab, and tabular
- Basic: label, text box, image, subreport, and banded object
- Web Controls
- Others: UDO, barcode, and multimedia objects
You can view the components in either icon view or list view. Select  to switch to list view, or
 ![]() to icon view.
to icon view.
The method to create a component using the Components panel is to drag an icon representing that component from the panel to the desired location in the report design area. For more information about the usage of each component, see Components.
 Previous Topic
 Back to top