 Previous Topic
Formatting the Bars in a Bar/Bench Chart
This topic describes how you can format the bars in a bar or bench chart.
- Right-click any bar/bench in the bar/bench chart and select Format 2D Bar or Format 3D Bar from the shortcut menu or double-click any bar/bench in the chart. Designer displays the Format Bar dialog box.
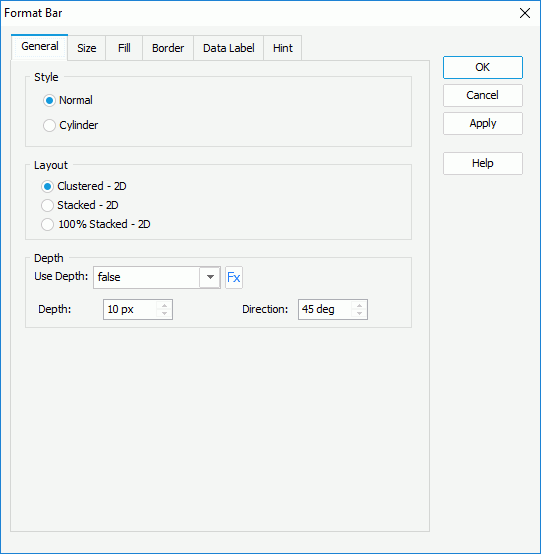
- In the General tab, specify the general properties of the bars.
- For a 2-D bar/bench chart, specify the style and layout of the bars. If you want to add a 3-dimensional effect to the bars, set Use Depth to true and specify the depth and direction. If the chart uses a query resource, you can use a formula to control the Use Depth option.
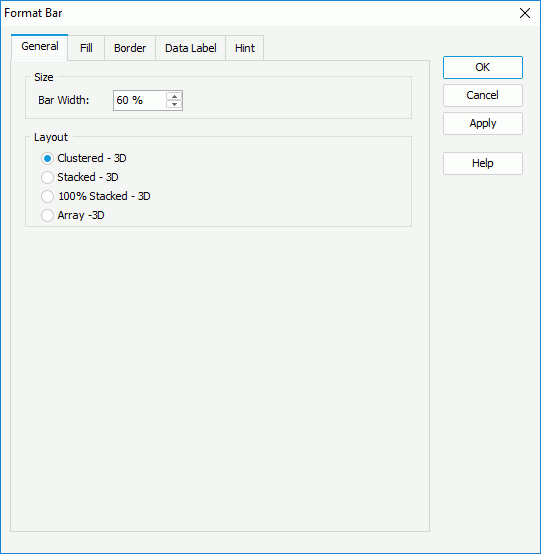
- For a 3-D bar/bench chart, specify the bar width as a percentage of the unit width, and the layout of the bars.
- For a 2-D bar/bench chart, specify the style and layout of the bars. If you want to add a 3-dimensional effect to the bars, set Use Depth to true and specify the depth and direction. If the chart uses a query resource, you can use a formula to control the Use Depth option.
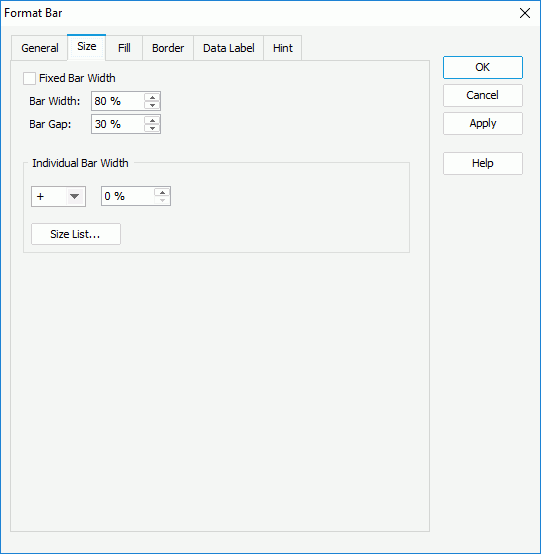
- For a 2-D bar/bench chart, in the Size tab, specify the size of the bars which can either be dynamic or fixed.
To use dynamic bar width, make sure Fixed Bar Width is unselected, specify the general bar width as a percentage of the unit width. If the chart is a clustered 2-D bar/bench chart which contains data on the series axis or has more than one value on the value axis, you can specify the gap between the bars as a percentage of the unit width, and in the Individual Bar Width box, specify how much the selected bars in the same data series is wider or narrower than a general bar in percentage. You can also select Size List to specify the size for bars in the same data series respectively in the Size List dialog box.
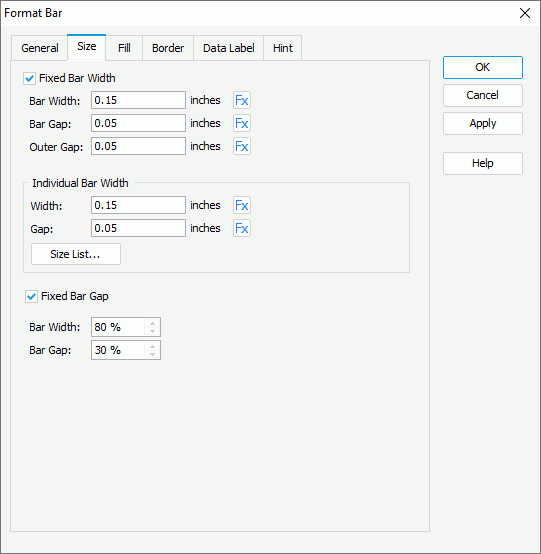
To use fixed bar width, select Fixed Bar Width, specify the general bar width. If the chart is a clustered 2-D bar/bench chart which contains data on the series axis or has more than one value on the value axis, you can specify the gap between the bars within a group, and the outer gap between bars out of a group. In the Individual Bar Width box, specify the width and gap for the selected bars in the same data series, or select Size List to specify the size for bars in the same data series respectively in the Size List dialog box. You can use formulas to control the options. To customize the bar gap by percentage, clear Fixed Bar Gap and specify the percentages of the bar width and bar gap within a group.
- In the Fill tab, specify the fill type and the color pattern to fill the bars.
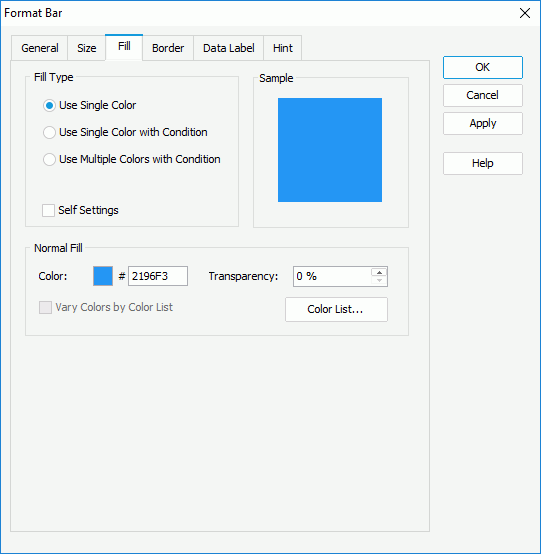
If you select the Use Single Color fill type, first make a choice for the Self Settings checkbox: when Self Settings is unselected (the default behavior), Designer synchronizes the color pattern that you specify here with the Pattern List property on the chart object in the Report Inspector, which data markers of other subtypes can also apply if the chart is a combo chart; when you select Self Settings, it indicates that the color pattern is private to the current data markers themselves (the bars in this case), which Designer remembers and applies to the data markers of a new type automatically if later you change the type of the chart. Then, specify the color pattern as follows:
- If the chart has no series field, specify the color and the transparency of the color to fill the bars (to change the color, select the color indicator and select a color from the color palette, or type the hexadecimal value of a color in the text box). If you want to apply different colors to the bars, select Vary Colors by Color List, then select Color List to specify the color pattern for each bar in the Color List dialog box.
- If the chart has series field, specify the color and transparency of the color to fill the bars in the current data series, that is the bars in the same data series as the one you have selected on to open the Format Bar dialog box. You can also select Color List to specify the color pattern for bars in each data series respectively in the Color List dialog box if the chart is a clustered bar chart.
If you select the Use Single Color with Condition or Use Multiple Color with Condition fill type, specify the conditions and the color pattern for each condition respectively. For more information, see Adding Conditional Color Fills to Charts.
- In the Border tab, specify the properties for the border of the bars/benches.
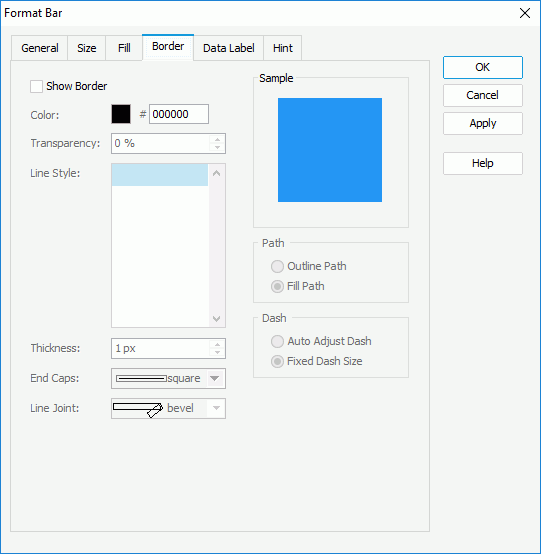
Select Show Border if you want to show the border of the bars, then specify the color, color transparency, line style, thickness, end caps style, and line joint mode of the border.
In the Path box, specify the fill pattern of the border: Outline Path or Fill Path.
In the Dash box, select to automatically adjust the dash size or use fixed dash size if you select a dash line style for the border.
- In the Data Label tab, specify the properties of the static data labels in the bar chart.
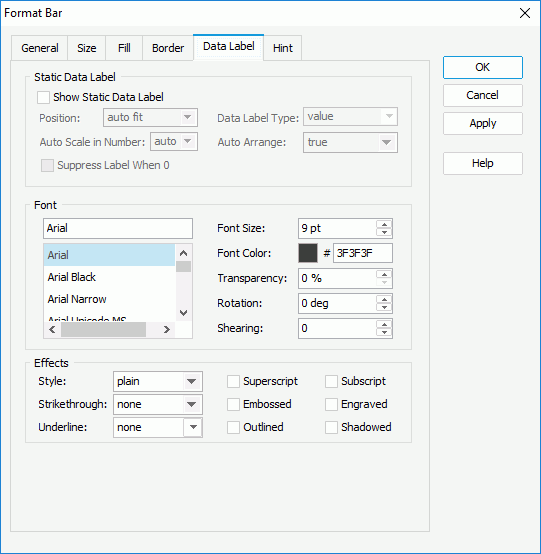
For a 2-D bar/bench chart, in the Static Data Label box, select Show Static Data Label if you want to show static data labels for the bars, then select the position of the data labels relative to the bars, in which way to display the values in the data labels, whether to scale big and small numbers in the data labels, and whether to hide the data label whose value is 0. When you select the Position option of "inside center", "inside top", or "inside bottom", Designer enables the Auto Arrange drop-down list, from which you can specify whether to display the data labels inside the bars at the best position.
In the Font box, specify the font format of the text in the data labels, including the font face, size, color, color transparency, rotation angle, shearing angle.
In the Effects box, specify the special effects for the text in the data labels such as style, strikethrough, and underline.
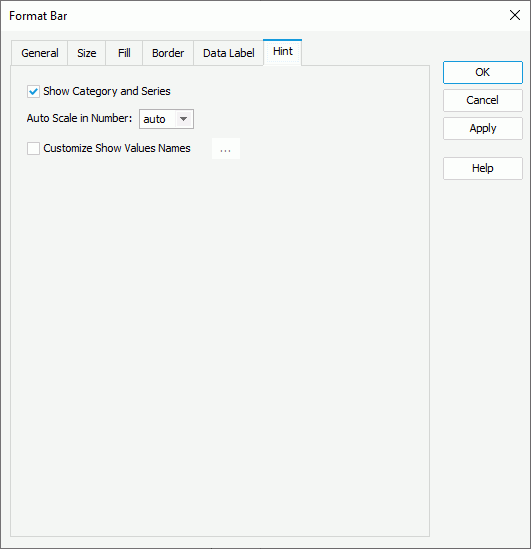
- In the Hint tab, specify the properties of the chart hint (the Show Tips property of the chart paper in the Report Inspector should be "true" if you want to show the hint): specify whether to include the category and series values in the hint, whether to scale big and small numbers, and whether to use customized names for the fields on the value axis in the hint, and customize the names as you want. A hint displays the value a bar represents when you point to the bar in Designer view mode, in HTML output, or at runtime.
- For a bar chart in a library component, you can define web behaviors on the bars in the Behaviors tab.
A web behavior contains a trigger event and a web action to be triggered when the event occurs on the bars at runtime. You can add as many web behaviors to the bars as you need.
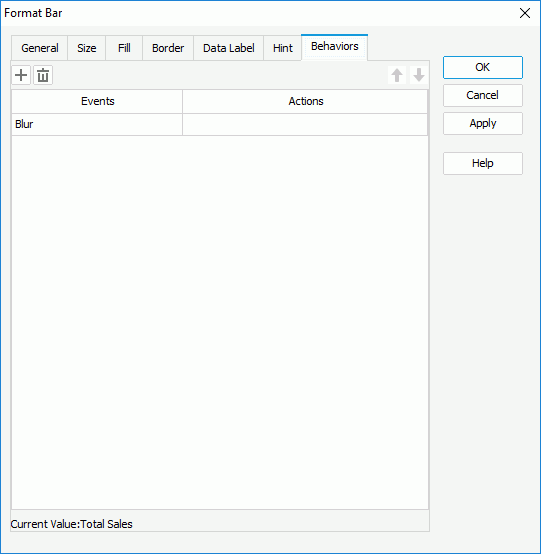
To define the web behavior, select a trigger event from the drop-down list in the Events column, then select in the Actions column and select the ellipsis
 . In the Web Action List dialog box, bind a web action the same as you do to web controls in the library component. The web actions you can bind include Filter, Sort, Parameter, Property, and SendMessage.
You can select Add
 to add and define more web behaviors; to delete a web behavior, select it and select Remove
  . You can also select a web behavior and select Move Up
  or Move Down
  to adjust the order of the behaviors, then at runtime, when an event that is bound with more than one action happens, JDashboard triggers the upper action first.
 - Select OK to accept the changes and close the dialog box.

- If the chart is a combo chart composed by bars and areas/lines, when you set the depth properties for the bars, Designer applies them to the areas/lines as well, and vice versa.
- If you set the style of the bars to "Cylinder", the style can take effect only when you specify Use Depth to "true" at the same time.
- For a 3-D bar chart, Designer disables the Show Static Data Label option in the Data Label tab of the Format Bar dialog box; however, you can still see the data labels by pointing to the bars when viewing the report result in Designer view mode, in HTML output, or in Page Report Studio.
 Back to top