Opening Visual Analysis in JDashboard
If your Logi Report Server enables Visual Analysis, you can access Visual Analysis directly from JDashboard without having to switch to the resource tree on the Server Console. JDashboard loads Visual Analysis as a tab with full functionality for you to perform data analysis with. This topic describes how you can open a new Visual Analysis or an analysis template in JDashboard.
This topic contains the following sections:
Opening a New Visual Analysis
You can use several ways to access Visual Analysis:
- On the dashboard title bar, leave the mouse pointer on the + button beside the rightmost tab for one second until JDashboard displays a drop-down menu, then select Analysis from the menu.
- On the toolbar, select the New button
 and then select Analysis.
 - On the toolbar, select the Options button
 and then select New > Analysis.
Opening an Analysis Template
You can access Visual Analysis for a specific analysis template, using dialog box, the Resources panel, or the component title bar.
- In JDashboard, select the Open button
 on the toolbar, or select the Options button
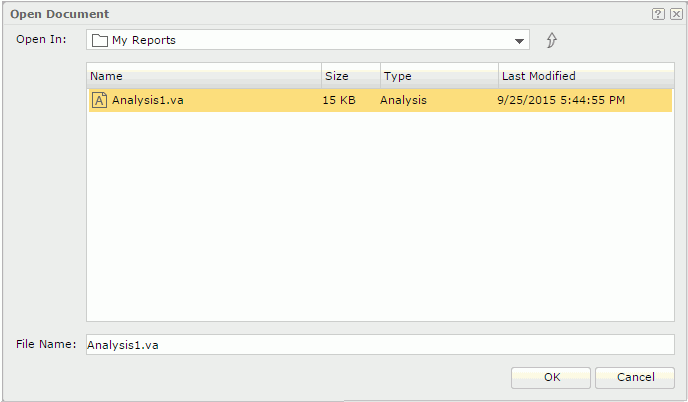
  and then select Open from the option list. JDashboard displays the Open Document dialog box.

- Browse to the desired folder, select the analysis template you want to open and then select OK. Or simply double-click the analysis template to open it.
- Select the Show Resources button
 on the toolbar. JDashboard displays the Resources panel.
 - Expand the Reports node.
- Browse to the target analysis template with .va as the suffix and drag it to the editing area.
JDashboard loads Visual Analysis in a new dashboard tab and displays the selected analysis template.
After you insert an analysis template in a dashboard as its component, select the Options button  on the component title bar, focus on Analyze on the drop-down menu, and then choose an item:
- In New Tab
Loads the specified analysis template in Visual Analysis in a new dashboard tab. - In New Window
Loads the specified analysis template in Visual Analysis in a new web browser window.
![]() JDashboard saves the changes that you made on the analysis template in Visual Analysis to the server resource tree. However, the changes does not affect the analysis template that you inserted as a component in a dashboard.
JDashboard saves the changes that you made on the analysis template in Visual Analysis to the server resource tree. However, the changes does not affect the analysis template that you inserted as a component in a dashboard.
 Previous Topic
 Back to top