Modifying Crosstabs
For any crosstab in a report, you can further edit it at any time. This topic introduces how you can modify a crosstab to change the data displayed in the crosstab and customize the layout of a crosstab.
This topic contains the following sections:
- Editing a Crosstab with Wizard
- Adding More Column/Row Headers and Aggregations
- Defining Comparison Functions
- Customizing the Crosstab Layout
Editing a Crosstab with Wizard
You can further modify a crosstab by accessing its shortcut menu wizard which contains a set of screens that are similar to the wizard screens used to create the crosstab. For example, you can change the data used by the crosstab, reset the layout and style of the crosstab.
- Right-click the crosstab and select Crosstab Wizard from the shortcut menu to display the Crosstab Wizard dialog box.
- In the Data screen, you can specify a new data source for the crosstab.
- In the Display screen, specify the fields you want to display in the crosstab.
- In the Layout screen, specify the layout of the crosstab.
- In the Style screen, set a style for the crosstab.
- Select Finish to accept the changes.
For more information about defining a crosstab, see Inserting Crosstabs in a Report.
Adding More Column/Row Headers and Aggregations
Besides using the wizard, you can drag fields from the Data panel of the main window to add column/row headers and aggregations in a crosstab.
To add a column/row header in a crosstab:
- In the Data panel, select a group objects
 or dynamic formulas used as Group
  if the crosstab is business view-based, or a DBField or formula if query-based.
 - Drag the field to an existing column/row header until a blue line appears (for a blank crosstab, drag the field to the Total label to create the first column or row header), then release the mouse button. A new column/row header is then added above/on the left of the column/row.
After you add a column/row header using the drag method, when you open the crosstab wizard, in the Display screen you can find the new fields in the corresponding box.
To add an aggregation in a crosstab:
You can add detail aggregations, subtotals, and grand totals in a crosstab by dragging an aggregate field to the crosstab. You can use the following fields as aggregate fields in crosstabs: aggregation objects  , detail objects
  , dynamic formulas used as Aggregation
  , dynamic formulas used as Detail
  , and dynamic aggregations
  in a business view; DBFields, formulas, and crosstab formulas in a query resource.
- From the resource tree in the Data panel, select a field that can be used as crosstab aggregate field.
- Drag the selected field to the aggregation area in the crosstab until a blue line appears, then release the mouse button. Designer displays the Insert Aggregation dialog box.
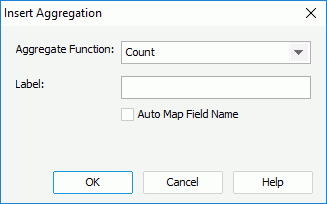
The location where you drop the field determines whether Designer creates detail aggregations, subtotals, or grand totals in the crosstab.
- From the Aggregate Function drop-down list, select the function to calculate the field. If you select DistinctSum, you should select the ellipsis
 next to the Distinct On text box to specify one or more fields according to whose unique values to calculate DistinctSum using the Select Fields dialog box.
 If you have defined an aggregate function for the selected field, you cannot edit the function any more, and the drop-down list changes to the Aggregation text box with the name of the field in it.
- In the Label text box, you can specify the label text for the aggregate field, which labels the newly created aggregations in the crosstab. If the crosstab uses a business view, you can use Auto Map Field Name to specify whether to automatically map the label text to the dynamic display name of the field at runtime. However, whether the crosstab can show the label depends on if you have added any labels to label the column headers/row headers/aggregations in the crosstab while creating or editing the crosstab with the crosstab wizard. If you do not specify any label in the wizard, Designer ignores the label you add in the Insert Aggregation dialog box.
- Select OK and Designer adds a new aggregation in the crosstab.
After you add an aggregation using the drag method, when you open the crosstab wizard, in the Display screen you can find the new fields in the corresponding box.
For the aggregations in a crosstab:
- If the aggregate field from which the aggregations are created has no predefined aggregate function, you can change the function of the aggregations at any time. To do this, select one or more aggregations, right-click and on the shortcut menu, select the required function from the Switch Aggregate Function submenu. If you select DistinctSum as the function, Designer displays the Select Fields dialog box for you to specify the fields according to whose unique values to calculate DistinctSum. The new function only applies to the specified aggregations and does not affect the functions that the corresponding aggregate fields use. In this way, you can make the detail aggregations, subtotals, and grand totals calculated from the same aggregate field apply different aggregate functions.
- Remove them if not required. To remove an aggregation, right-click it and select Remove Aggregation on the shortcut menu.
Defining Comparison Functions
A comparison function refers to calculations of percentage, permillage, or difference between:
- subtotal and grand total
- subtotal of inner group and subtotal of outer group
- values of aggregate field and subtotal
- values of aggregate field and grand total
To define comparison functions in a crosstab:
- When creating or editing a crosstab with the crosstab wizard, select an aggregate field in the Summaries box of the Display screen and select Comparison Function. Designer displays the Comparison Function dialog box.
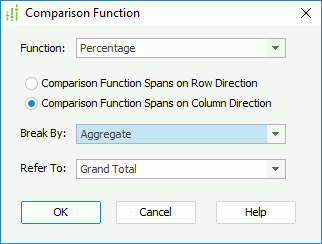
- From the Function drop-down list, select the required function: Percentage, Permillage, or Difference.
- Specify a position for the comparison function.
- Comparison Function Spans on Row Direction
Designer places the comparison function into the column total cell of the crosstab. - Comparison Function Spans on Column Direction
Designer places the comparison function into the row total cell of the crosstab.
- Comparison Function Spans on Row Direction
- The Break By and Refer To drop-down lists together determine the numbers that form the calculation of the comparison function.
Items in the Break By drop-down list vary based on the position of the comparison function. It specifies the first parameter of the comparison function: the detail aggregation in the crosstab (Aggregate) or the subtotal of a specified row/column group.
Items in the Refer To drop-down list also vary according to what you have selected from the Break By drop-down list. It specifies the other parameter of the comparison function: the grand total or subtotal for an outer row/column group.
- Select OK and you can find that Designer adds a new field in the Summaries box. You can set the display name for the field in the Label column.
- Repeat the above steps to define comparison functions for other aggregate fields in the crosstab.
- Select Finish in the Crosstab Wizard dialog box to apply the settings.
The following presents an example of using comparison function in a crosstab. It assumes that you have a web report with a crosstab in it in the catalog SampleReports.cat saved in <install_root>\Demo\Reports\SampleReports. The crosstab contains the following information:
- Uses WorldWideSalesBV in Data Source 1 of the catalog.
- Displays the group objects Product Type and Category as the column fields, Country and State as the row fields, the detail object Quantity as the aggregate field and apply Sum as the aggregate function.
- Applies the filter "Country = Canada OR Country = France".
- Uses vertical layout with Number of Rows as 1.
- Takes the Classic style.
The crosstab shows information about product sales volume in each state of Canada and France.
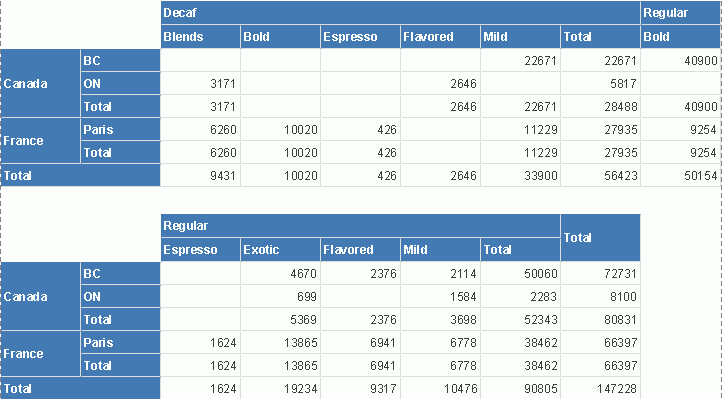
Now, you want to define a comparison function in the crosstab to show the percentage of each state's sales volume to the grand total.
- Right-click the crosstab and select Crosstab Wizard on the shortcut menu. Designer displays the Crosstab Wizard dialog box.
- In the Display screen, select Quantity in the Summaries box, then select Comparison Function.
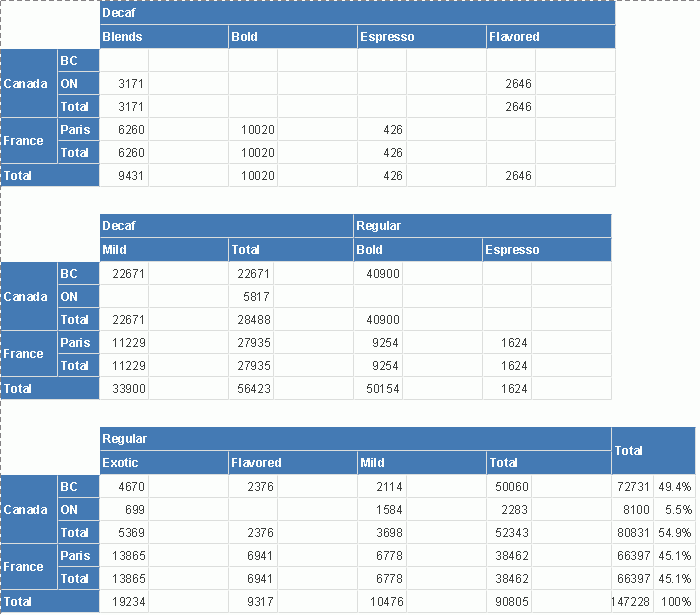
- In the Comparison Function dialog box, select Percentage from the Function drop-down list, select Comparison Function Spans on Row Direction, specify Product Type as the break by field and choose Grand Total from the Refer to list. Select OK
- Select Finish in the Crosstab Wizard dialog box to accept the settings.
- In the Report Inspector, modify the value of the Format property of the fields corresponding to the percentage to #,###.##% (the fields are represented as QUANTITY9, QUANTITY10, and QUANTITY11 respectively in the Report Inspector).
- Preview the crosstab again and you can see that Designer adds a percentage to the right of each state's sales volume.
Customizing the Crosstab Layout
When you create or edit a crosstab, you can use the Layout screen of the crosstab wizard to customize the layout of the crosstab according to specific data displayed in the crosstab so as to make the data more intuitive and readable. You can also customize the layout of a crosstab by setting properties in the Report Inspector.
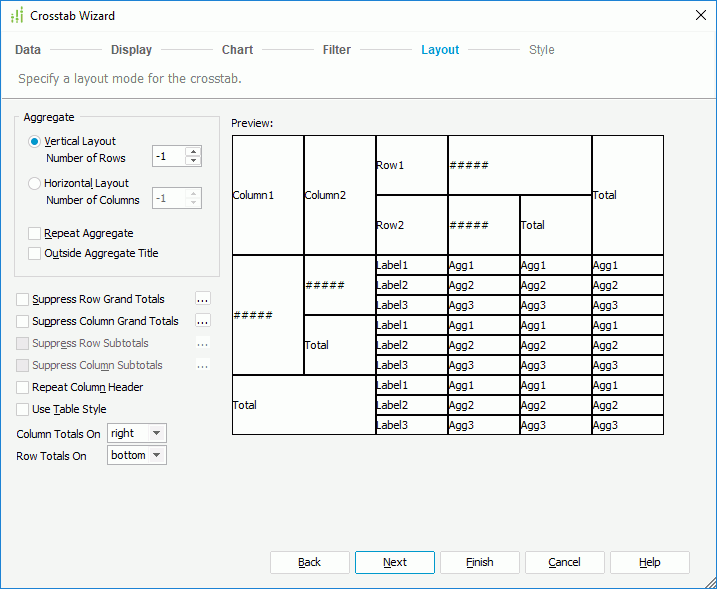
You see the following properties in the Layout screen:
Aggregate
You can specify the properties of the aggregate fields in this box.
- Vertical Layout
Select to arrange the aggregate fields vertically.- Number of Rows
Specify the number of the rows to hold the aggregate fields in the crosstab. By default, it is -1 which means that Designer places each aggregate field in a row so that the aggregate fields are positioned in one column vertically. Designer treats 0 and a number equal to or larger than the number of the aggregate fields in the crosstab as -1. If you set the number of rows (3 for example) less than the number of aggregate fields (6 for example), Designer uses 3 rows to hold the 6 fields with each row containing 2 fields.
- Number of Rows
- Horizontal Layout
Select it to arrange the aggregate fields horizontally. When you have multiple aggregate fields in the crosstab, using horizontal layout can make the report more readable.- Number of Columns
Specify the number of the columns to hold the aggregate fields in the crosstab. By default, it is -1 which means that Designer places each aggregate field in a column so that the aggregate fields are positioned in one row horizontally. Designer treats 0 and a number equal to or larger than the number of the aggregate fields in the crosstab as -1. If you set the number of columns (3 for example) less than the number of aggregate fields (6 for example), Designer uses 3 columns to hold the 6 fields with each column containing 2 fields.
- Number of Columns
- Repeat Aggregate
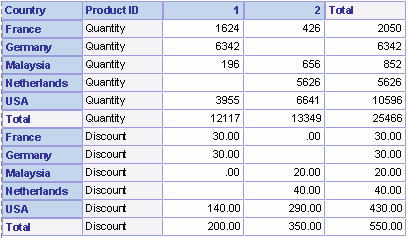
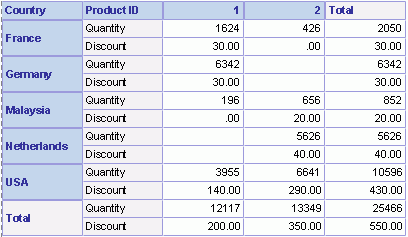
Select to repeat the crosstab for different aggregate fields. If you select the option, one aggregate cell contains only one aggregate field value, while for the other aggregate fields, the crosstab repeats; if you clear the option, one aggregate cell accommodates the values of all aggregate fields. When you select the option, Designer ignores the value that you set for Number of Rows or Number of Columns.The following sample shows the difference:
- Repeat Aggregate selected:
- Repeat Aggregate unselected:
- Repeat Aggregate selected:
- Outside Aggregate Title
Specify to place the aggregate field labels on the leftmost column when the aggregate layout is vertical, or on the topmost row of the crosstab when the aggregate layout is horizontal. Selecting this option would make the labels of the aggregate fields far from their values.
Suppress Row Grand Totals
Select to suppress the grand total row in the crosstab. For a compound crosstab, you can select the ellipsis  to customize the grand totals of which column compound groups you want to suppress and which you want to show in the Suppress Row Grand Totals dialog box
Suppress Column Grand Totals
Select to suppress the grand total column in the crosstab. For a compound crosstab, you can select the ellipsis  to customize the grand totals of which row compound groups you want to suppress and which you want to show in the Suppress Column Grand Totals dialog box.
Suppress Row Subtotals
Select to suppress the subtotals of the row fields in the crosstab. You can select ellipsis  to customize which subtotals of the row fields you want to suppress and which you want to show in the Suppress Row Subtotals dialog box.
Suppress Column Subtotals
Select to suppress the subtotals of the column fields in the crosstab. You can select the ellipsis  to customize which subtotals of the column fields you want to suppress and which you want to show in the Suppress Column Subtotals dialog box.
Repeat Column Header
Select to display the column headers on every page when the crosstab spans more than one page.
Use Table Style
Select to add labels to the Total rows and columns. If you select the option, you may find the row and column labels are repeated too much.
Column Totals On
Specify to display the subtotal and grand total columns on the left or right of the detail aggregations.
Row Totals On
Specify to display the subtotal and grand total rows on the top or bottom of the detail aggregations.
 Previous Topic
 Back to top