Going Through Web Report Data
In a web report, you can switch from a group to another to see the data you want, and view the detail information of the summary values with the going actions. This topic describes the different types of going actions: go to, go to by value, go down, go up, and go to detail.
This feature is not supported on org charts.
-
Go-To
You can obtain a different view of data by switching between the groups. -
Go-to-by-Value
You can filter data based on a go-to action to obtain a more detailed view of the data. -
Go-Down
You can drill data to lower-level groups according to predefined hierarchies. For more information, see Defining Hierarchies in a Business View in the Logi Report Designer Guide. -
Go-Up
You can go to higher-level groups according to predefined hierarchies. -
Go-to-Detail
You can concentrate on the detail information of summaries.
After you perform a going action, Server reloads the data presented in the component from the data buffer, showing only the requested data. You can view, print, and export the new component to other formats in the same way as with the original component.
Assume you have created a chart of Clustered Bar 2-D type on the business view WorldWideSalesBV in Data Source 1 of the SampleReports catalog in the SampleReports folder. The chart displays product sales information with Region as the field on the category axis, Sales Year as the field on the series axis, and Total Sales as the field on the value axis, and applies the Classic style. The chart looks as follows:
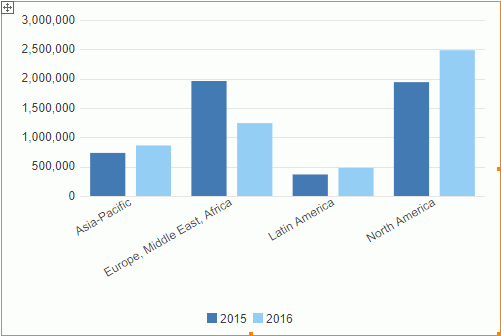
The business view WorldWideSalesBV has defined the following hierarchical group levels: Region > Country > State > City.
We will now take the chart as an instance to illustrate the going actions.
Go-To
The go-to action enables jumping to a different group by replacing the current. You can perform it on chart categories and series.
- Right-click any region on the category axis, Asia-Pacific for example, and choose Go To from the shortcut menu. Server lists the groups available for the action on the submenu, which are all the other group objects in the business view used by the chart.
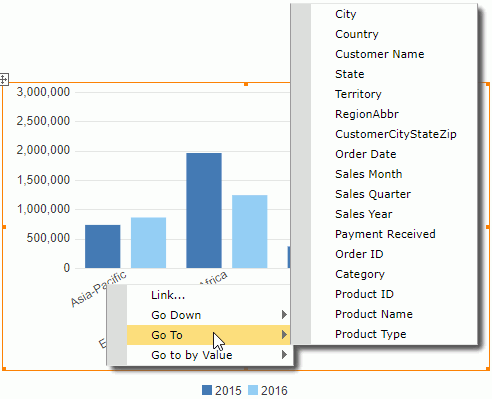
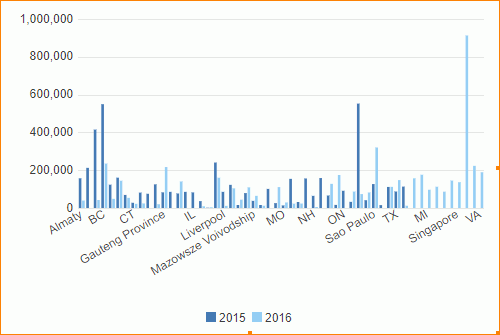
- Select State on the submenu. In the regenerated result, we can see that State becomes the group for categories and Sales Year remains the group for series.
Go-to-by-Value
The go-to-by-value action enables showing the information of another group while applying the current value that you select on as a filter condition. You can perform it on crosstab column/row headers, table/banded object groups, and chart categories and series.
- Go back to the original chart in the preceding example by selecting the Undo button
 on the toolbar.
 - Right-click Asia-Pacific on the category axis, and select Go to By Value on the shortcut menu. Server displays a submenu and lists the same items as those of Go To.
- Select State too. The result is:
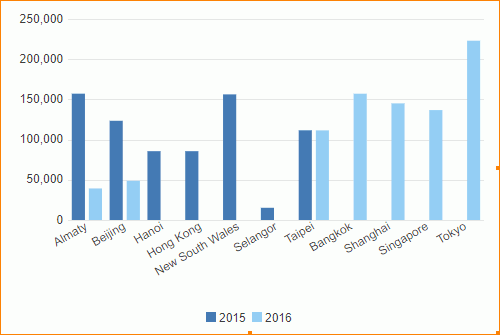
We can see that the result is different from that of go-to. This is because that, for the go-to-by-value action, the group of categories changes to State while being filtered by the Region value Asia-Pacific. That is, based on the go-to action, Server performs a filtering action Region = Asia-Pacific at the same time. In addition, when you perform a go-to-by-value action, Server displays the "Go To" Filter panel on the left of the Web Report Studio window, showing the group and the value that the filter is based on.

Go-Down
The go-down action enables going from a non-bottom level group to the one-level-lower group while applying the currently selected value as a filter condition. You can perform it perform on table/banded object groups, crosstab column/row headers, and chart categories and series.
- Go back to the original chart in the preceding example by selecting the Undo button
 on the toolbar.
 - Right-click the value Asia-Pacific, and select Go Down on the shortcut menu. Server lists Country as the submenu item.
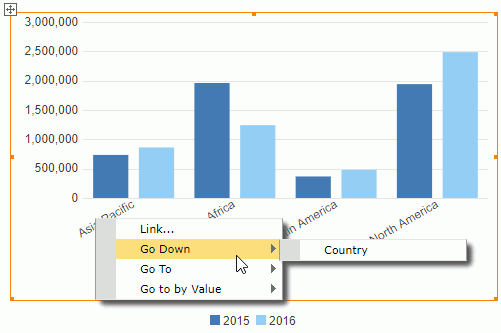
- Select Country. The chart now displays the data about countries in the Asia Pacific region.
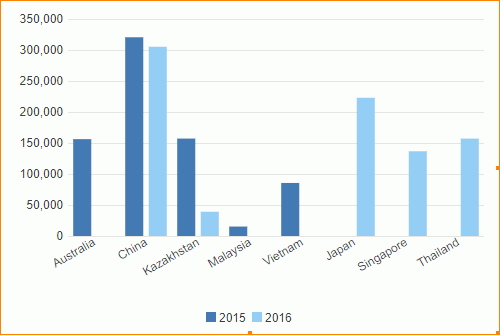
- The one-level-lower group for Country defined in the hierarchy is State. Right-click on China and select Go Down > State. The chart now shows states in China.
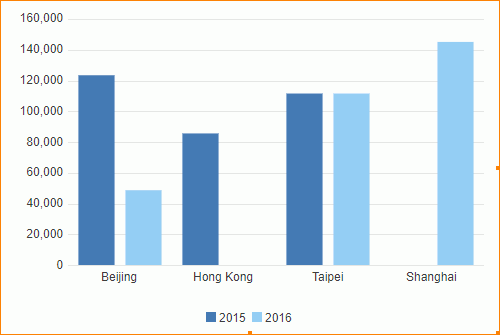
After these two go-down actions, we can see Server adds two filters in the "Go To" Filter panel, "Region : Asia-Pacific" and "Country : China".
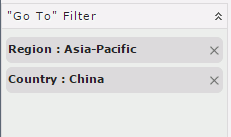
This is because, when you perform a go-down action, Server creates a filter based on the value you select on. In this example, we first select on the Asia-Pacific region, so Server drills this region to the lower level to display countries in Asia Pacific, and thus creates the filter Region = Asia-Pacific. If you want all data in the one-level-lower group to display when you drill down a group, you can remove the corresponding filter from the "Go To" Filter panel, by selecting X beside the filter condition.
Go-Up
The go-up action enables going from a group which is non-top level in a predefined hierarchy to the one-level-higher group. You can perform it on table/banded object groups, crosstab column/row headers, and chart categories and series.
- Based on the report result after go-down, right-click any value of State, Beijing for example, and select Go Up on the shortcut menu. We can see Country is the submenu item.
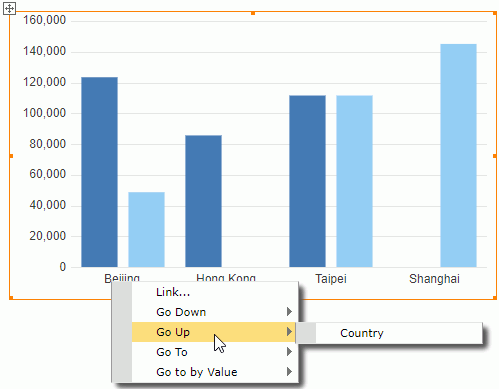
- Select Country to update the chart. Country is now the group for categories, and Server removes the filter condition Country = China from the "Go To" Filter panel.

- The one-level-higher group for Country defined in the hierarchy is Region. Now right-click any value of Country, Australia for example, on the shortcut menu, select Go Up > Region. The chart restores to the original state.

Go-to-Detail
The go-to-detail action enables you to concentrate on the detail information of each summary value. You can perform it on summaries in tables, crosstabs, banded objects, and the chart data markers.
- Right-click the bar represents the total sales of Asia-Pacific in 2016 and select Go to Detail on the shortcut menu.
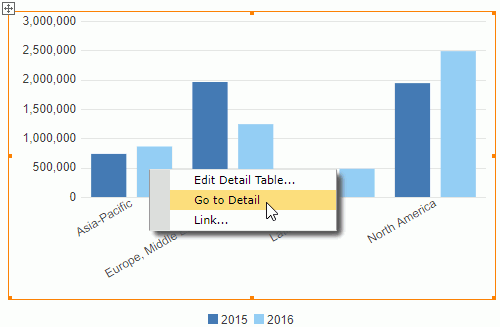
- Server displays the detail table of the summary value in the same frame or a new window, according to the setting of Target of Detail Table Report and Links in the Web Report Studio profile. By default, the detail table contains all the group and detail objects in the same business view category as the aggregate object from which the summary value is generated.
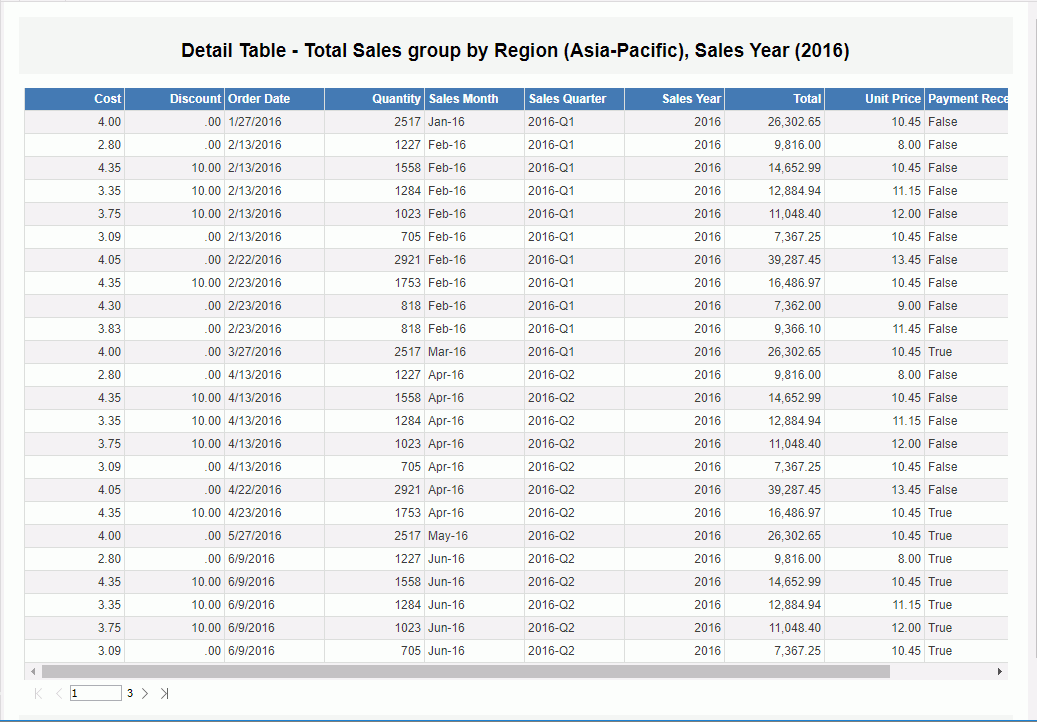
- If Server displays the detail table in the same frame as the original report, you can select the Back button
 on the toolbar to go back to the original report.
In most cases, the default detail table may not well satisfy your requirements. Web Report Studio provides you with the option to customize the detail table by your own.
To edit the detail table for the go-to-detail action:
- Right-click any summary value (for a chart it is any data marker) and select Edit Detail Table from the shortcut menu. Server displays the Edit Detail Table dialog box.
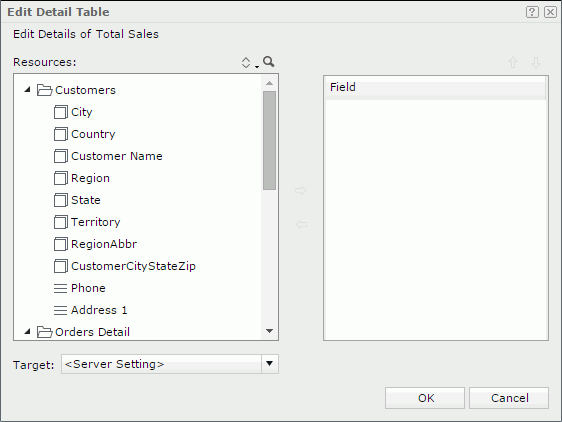
- The Resources box lists all the group and detail objects in the business view used by the current data component. Add the fields you want to display in the detail table to the right box.
- You can use the Sort button
 and the Search button
  to sort and search for resources in the left box.
 - To adjust the order of the added fields in the right box, select the Up button
 or the Down button
  .
. - From the Target drop-down list, select the window or frame in which to load the detail table.
- New Window
Server loads the detail table into a new window. - Same Frame
Server loads the detail table into the same frame or window where the main report is. - Other Frame
Server loads the detail table into some other available frame. Type the frame name into the text box to find the frame. If the frame does not exist, Server loads the detail table report into a new window. - <Server Setting>
Server loads the detail table according to the setting of the Target of Detail Table Report and Links option in the Web Report Studio profile.
- New Window
- Select OK to finish defining the detail table.
- Perform the go-to-detail action on a summary value and the detail table displays the information you defined.
![]()
- If the table type is Group Above, you can right-click its group header to show the shortcut menu to use the going function. For other table types, you have to right-click the group name in a group column to perform going.
- For a web report created in Logi Report Designer, if at the report design time the report designer gave the "Drill-down" action the highest Click Priority, you can also select the group object directly to go down to the next level in the View Mode of Web Report Studio.
 Previous Topic
 Back to top