 Previous Topic
To Crosstab Dialog Box Properties
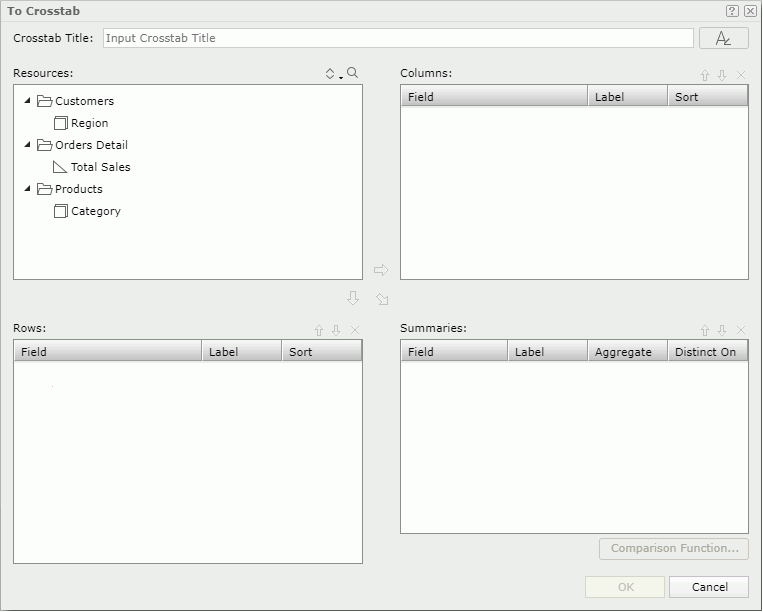
This topic describes how you can use the To Crosstab dialog box to specify settings for converting a chart into a crosstab. Server displays the dialog box when you right-click a chart and then select To Crosstab on the shortcut menu or select Menu > Edit > To Crosstab.
Title
Specifies a title for the crosstab.

Specifies the font properties of the chart title. After you select the button, Server displays the following dialog box for you to edit the font properties:

- Font
Select the font face of the title. - Font Style
Select the font style of the title: regular, bold, italic, and bold italic. - Size
Specify the font size of the title. - Align
Specify the position of the title to be left, right, center, or justify. - Font Color
Specify the font color of the title.To change the color, select the color indicator. Server displays the color palette. Select a color, or select More Colors to access the Color Picker dialog box in which you can specify a color within a wider range. You can also type a hexadecimal RGB value to specify a color, for example, #9933ff.
- Background Color
Specify the background color of the title. - OK
Select to apply any changes you made here and exit the dialog box. - Cancel
Select to close the dialog box without saving any changes.
Resources
Displays all the view elements used in the chart.

Sorts the view elements in the specified order from the drop-down list. Once a user changes the order, it will be applied to all the resource trees where business view elements are listed for this user.
- Predefined Order
Select if you want to sort the resources in the order as in the Business View Editor of Designer. - Resource Types
Select if you want to sort the resources by the resource type. Namely, category objects come first, then group objects, then aggregation objects, and at last detail objects. - Alphabetical Order
Select if you want to sort the resources in alphabetical order. Logi Report sorts the resources that are not in any category first, and then the categories. It also sorts the resources in each category alphabetically.

Launches the search bar to search for view elements.
See the following properties in the search bar:

- Text box
Type the text you want to search in the text box. Server lists the values that contain the matched text.  Close button
Select to close the search bar.-
 More Options button
Select the button and Server displays more search options.- Highlight All
Select if you want to highlight all matched text. - Match Case
Select if you want to search for text that meets the case of the typed text. - Match Whole Word
Select if you want to search for text that looks the same as the typed text.
- Highlight All
-
 Previous button
Select to go to the previous matched text when you have selected Highlight All. -
 Next button
Select to go to the next matched text when you have selected Highlight All.

Adds the selected group object  to be displayed in the columns of the crosstab.

Adds the selected group object to be displayed in the rows of the crosstab.

Adds the selected aggregation object  to be the summary field of the crosstab.
Columns/Rows
Lists the group objects that will be displayed on the columns/rows of the crosstab.
- Field
Lists the group objects that you selected to display in the crosstab. - Label
Specifies the text of the labels for the column/row headers. You can select a text box to edit the label, or select the Auto Map Field Name checkbox beside the text box to automatically map the label to the dynamic display name of the object. - Sort
Specifies how the selected group objects will be sorted.
Summaries
Lists the aggregation/detail objects that will be the summary fields of the crosstab.
- Field
Lists the aggregation/detail objects that you selected to display in the crosstab. - Label
Specifies the text of the labels for the summaries. You can select a text box to edit the label, or select the Auto Map Field Name checkbox beside the text box to automatically map the label to the dynamic display name of the object. - Aggregate
Specifies the functions used to summarize data of the detail objects. - Distinct On
Available and should be set when DistinctSum is selected as the aggregate function. It specifies the detail objects according to whose unique values to calculate DistinctSum. Select the ellipsis button to select the detail objects in the Select Fields dialog box.
 - Comparison Function
Opens the Comparison Function dialog box to add a comparison function as an aggregate for the crosstab.
 Move Up button
Select to move the selected item higher in the list.
 Move Down button
Select to move the selected item lower in the list.
Removes the selected view element.
OK
Applies the settings and closes the dialog box.
Cancel
Cancels the settings and closes the dialog box.

Displays the help document about this feature.

Ignores the setting and closes this dialog box.
 Back to top