Chart Properties
This topic describes how you can use the Chart Properties dialog box to update the properties of a chart. The dialog box varies for a general chart and a KPI chart.
Server displays the dialog box when you right-click a chart and select Properties from the shortcut menu.
This topic contains the following sections:
General Chart Properties
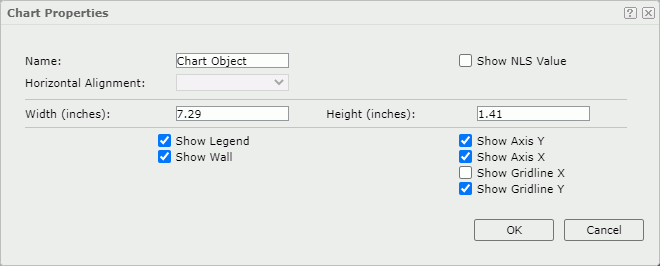
When you use the Chart Properties dialog box to set the properties for a general chart, it is like this:

Name
Specify the display name of the chart.
Show NLS Value
Select to show the translated name for the display name of the object in the Name text box if you have enabled the NLS feature and translated it, and when you have not modified the display name of the object.
Horizontal Alignment
Specify the horizontal justification of the chart. It works when the chart position is static. Choose an item from the list.
- left
Select to align the chart on the left of the parent container. - right
Select to align the chart on the right of the parent container. - center
Select to align the chart in the center of the parent container.
Width
Specify the width of the chart in inches.
Height
Specify the height of the chart in inches.
Show Legend
Select to display the legend in the chart.
Show Wall
Select to display the wall in the chart.
Show Axis Y
Select to display the Y axis.
Show Axis X
Select to display the X axis.
Show Gridline X
Select to display the gridlines perpendicular to the X axis.
Show Gridline Y
Select to display the gridlines perpendicular to the Y axis.
OK
Select to apply any changes you made here and exit the dialog box.
Cancel
Select to close the dialog box without saving any changes.
 Help button
Select to view information about the dialog box.
 Close button
Select to close the dialog box without saving any changes.
KPI Chart Properties
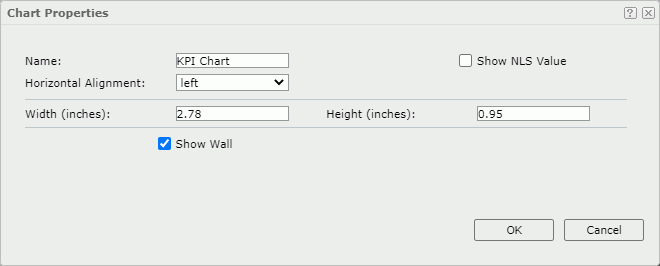
When you use the Chart Properties dialog box to set the properties for a KPI chart, it is like this:

Name
Specify the display name of the chart.
Show NLS Value
Select to show the translated name for the display name of the object in the Name text box if you have enabled the NLS feature and translated it, and when you have not modified the display name of the object.
Horizontal Alignment
Specify the horizontal justification of the chart in the KPI. It works when the chart position is static. Choose an item from the list.
- left
Select to align the chart on the left of the KPI. - right
Select to align the chart on the right of the KPI. - center
Select to align the chart in the center of the KPI.
Width
Specify the width of the chart in inches.
Height
Specify the height of the chart in inches.
Show Wall
Select to show the wall in the chart.
OK
Select to apply any changes you made here and exit the dialog box.
Cancel
Select to close the dialog box without saving any changes.
 Help button
Select to view information about the dialog box.
 Close button
Select to close the dialog box without saving any changes.
 Previous Topic
 Back to top