Format Rectangle Title Dialog Box
You can use the Format Rectangle Title dialog box to format the rectangle titles of the specified group in a heat map. This topic describes the options in the dialog box.
Designer displays the Format Rectangle Title dialog box when you do either of the following:
- When there is only one group in the heat map, right-click the heat map and select Format Rectangle Title from the shortcut menu.
- When there are two or more groups in the heat map, right-click the heat map and select a desired group field from the Format Rectangle Title submenu.
The dialog box contains the following tabs:
You see these buttons in the tabs:
OK
Select to apply your settings and close the dialog box.
Cancel
Select to close the dialog box without saving any changes.
Apply
Select to apply all changes and leave the dialog box open.
Help
Select to view information about the dialog box.
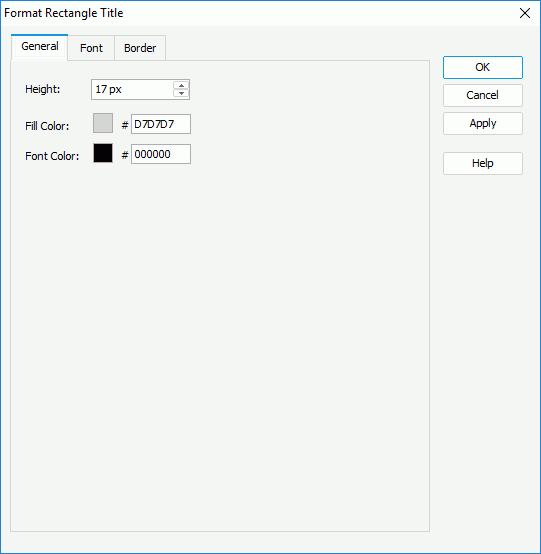
General Tab
Use this tab to specify the general properties of the rectangle titles.

Height
Specify the height of the rectangle titles.
Fill Color
Specify the color to fill the rectangle titles. To edit the color, select the color indicator and select a color from the color palette or type the hexadecimal value of a color (for example, 0xff0000) in the text box.
Font Color
Specify the color of the text in the rectangle titles.
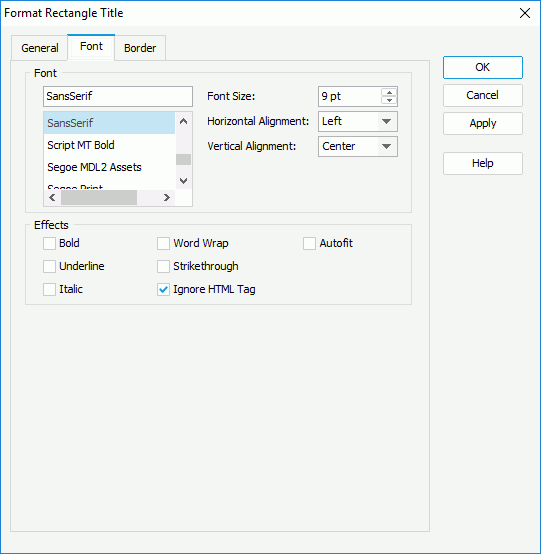
Font Tab
Use this tab to specify the font properties of the rectangle titles.

Font
You can specify the font format of the text in the rectangle titles in this box.
- Font list
This drop-down list contains all the font faces that you can select to apply to the text. - Font Size
Specify the font size of the text. - Horizontal Alignment
Select the horizontal alignment of the text in the rectangle titles. - Vertical Alignment
Select the vertical alignment of the text in the rectangle titles.
Effects
You can specify the special effects for the text in the rectangle titles.
- Bold
Select to apply the bold style to the text. - Underline
Select to add a horizontal line under the text. Web Report Studio and JDashboard do not support underlining chart text, therefore, Logi Report Engine ignores this property when the chart runs in Web Report Studio or is used in a dashboard.
 - Italic
Select to italicize the text. - Word Wrap
Select to wrap the text according to the width of the titles. - Strikethrough
Select to draw a line through the text. - Ignore HTML Tag
By default, Logi Report Engine ignores the HTML tag elements that are included in the text at runtime and in the HTML output of the report, so they display exactly as what they are. Clear the option if you want Logi Report Engine to transfer the HTML tag elements to the web browser, so they are translated into HTML by the web browser. - Autofit
Select to automatically adjust the width of the titles.
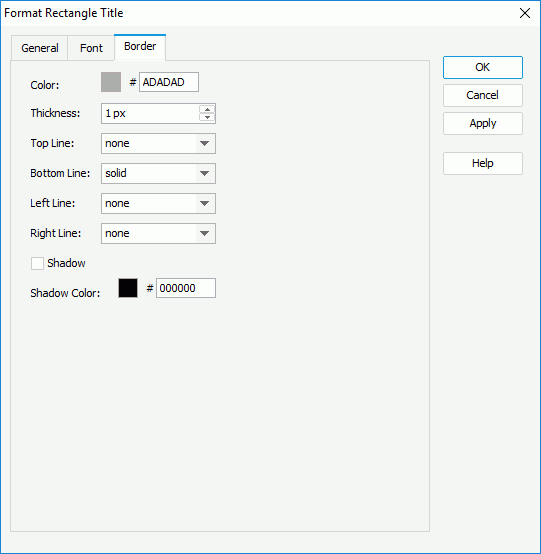
Border Tab
Use this tab to specify the border properties of the rectangle titles.

Color
Specify the color of the border. To edit the color, select the color indicator and select a color from the color palette or type the hexadecimal value of a color (for example, 0xff0000) in the text box.
Thickness
Specify the thickness of the border.
Top Line
Select the line style of the top border.
Bottom Line
Select the line style of the bottom border.
Left Line
Select the line style of the left border.
Right Line
Select the line style of the right border.
Shadow
Select to add a drop shadow effect to the border.
-
Shadow Color
Specify the color of the border shadow.
 Previous Topic
 Back to top