Format Value (Y) Axis Dialog Box Properties
This topic describes how you can use the Format Value (Y) Axis dialog box to format the value (Y) axis of a chart. Server displays the dialog box when you right-click a chart and select Format Axes (unavailable to pie, indicator, heat map and org charts) > Format Value (Y) Axis from the shortcut menu.
This topic contains the following sections:
- Axis Tab Properties
- Tick Mark Tab Properties
- Font Tab Properties
- Orientation Tab Properties
- Format Tab Properties
You see these elements on all the tabs:
OK
Select OK to apply any changes you made here.
Cancel
Select Cancel to close the dialog box without saving any changes.

Select to view information about the Format Value (Y) Axis dialog box.

Select to close the dialog box without saving any changes.
Axis Tab Properties
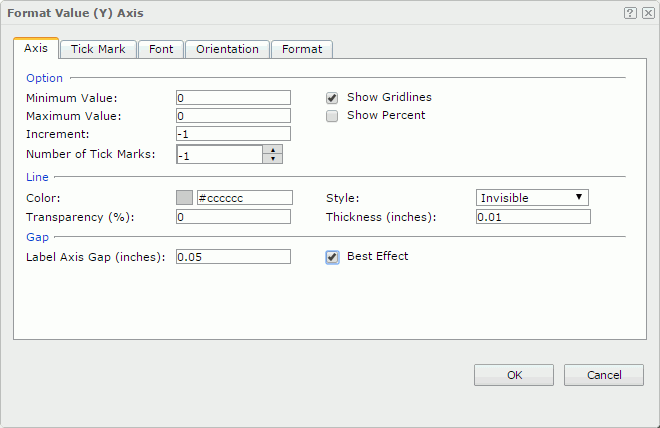
Specifies the general properties for the axis.
Option
Specifies the options for the axis.
- Minimum Value
Specifies the minimum value that is to be displayed on the axis. - Maximum Value
Specifies the maximum value that is to be displayed on the axis. - Increment
Specifies the difference between two adjacent values on the axis. - Number of Tick Marks
Specifies how many tick marks to be displayed on the axis. - Show Gridlines
Specifies whether to show the horizontal gridlines in the chart. - Show Percent
Specifies whether to show the value labels on the axis in percent. Only applies to bullet, bar/bench, line, and area chart that are not 100% stacked type.
Specifies the line style for the axis.
- Color
Specifies the color of the axis. - Style
Specifies the style of the axis. - Transparency
Specifies the transparency for the color of the axis. - Thickness
Specifies the thickness of the axis, in inches.
Gap
Specifies the gap properties for the labels on the axis.
- Label Axis Gap
Specifies the distance between the label and the axis, in inches. - Best Effect
Specifies whether to adjust the labels on the axis automatically to make them placed best.
Tick Mark Tab Properties
The tab consists of two sub tabs:
Major Tick Mark
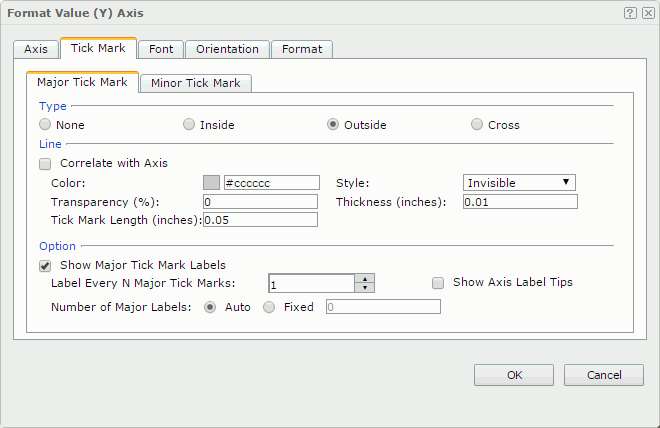
Specifies properties of the major tick marks on the axis.
Type
Specifies the type of the major tick marks on the axis.
- None
If selected, major tick marks will not be shown on the axis and it will be meaningless to specify all the other major tick mark related properties. - Inside
If selected, major tick marks will be inside the chart. - Outside
If selected, major tick marks will be outside the chart. - Cross
If selected, major tick marks will be across the axis.
Line
Specifies the line properties of the major tick marks on the axis.
- Correlate with Axis
If the option is selected, the line properties of the major tick marks will correlate with that of the axis automatically.- Color
Specifies the color of the major tick marks. - Transparency
Specifies the transparency for the color of the major tick marks. - Style
Specifies the type of the major tick marks. - Thickness
Specifies the thickness of the major tick marks, in inches.
- Color
- Tick Mark Length
Specifies the length for the major tick marks, in inches.
Option
Specifies the other properties of the major tick mark labels on the axis.
- Show Major Tick Mark Labels
Specifies whether to display the labels of the major tick marks on the axis. If the option is selected, the following properties will be enabled. - Label Every N Major Tick Marks
Specifies the frequency at which the major tick marks will be labeled. - Show Axis Label Tips
Specifies whether to display the complete label text when the mouse pointer points at a label on the axis. - Number of Major Labels
Specifies how many major tick mark labels to be displayed on the axis.- Auto
If the option is selected, all major tick mark labels will be shown. - Fixed
If the option is selected, you can specify the number of the major tick mark labels to be displayed on the axis.
- Auto
Minor Tick Mark
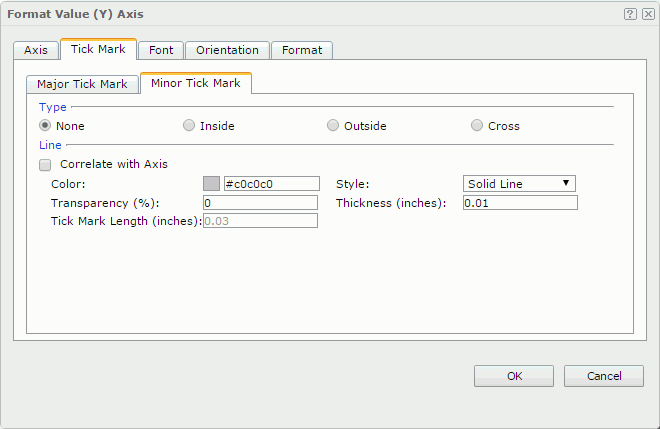
Specifies properties of the minor tick marks on the axis.
Type
Specifies the type of the minor tick marks on the axis.
- None
If selected, minor tick marks will not be shown on the axis and it will be meaningless to specify all the other minor tick mark related properties. - Inside
If selected, minor tick marks will be inside the chart. - Outside
If selected, minor tick marks will be outside the chart. - Cross
If selected, minor tick marks will be across the axis.
Line
Specifies the line properties of the minor tick marks on the axis.
- Correlate with Axis
If the option is selected, the line properties of the minor tick marks will correlate with that of the axis automatically.- Color
Specifies the color of the minor tick marks. - Style
Specifies the type of the minor tick marks. - Transparency
Specifies the transparency for the color of the minor tick marks. - Thickness
Specifies the thickness of the minor tick marks, in inches.
- Color
- Tick Mark Length
Specifies the length of the minor tick marks, in inches.
Font Tab Properties
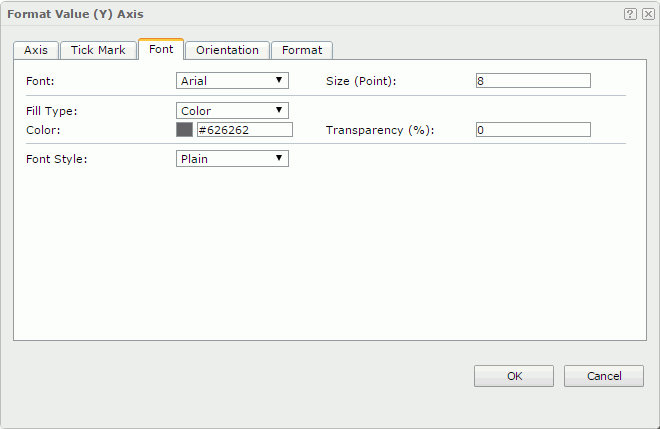
Specifies the font format for text in the major tick mark labels on the axis.
Font
Specifies the font face of the label text.
Size
Specifies the font size of the label text.
Fill Type
Specifies the fill type of the label text. It can be one of the following: None, Color, Texture, and Gradient.
Color
Specifies the color of the label text. It takes effect only when Fill Type in this tab is Color.
Transparency
Specifies the color transparency of the label text.
Font Style
Specifies the font style of the text. It can be one of the following: Plain, Bold, Italic and Bold Italic.
Orientation Tab Properties
Specifies the rotation angle of the major tick mark labels on the axis.
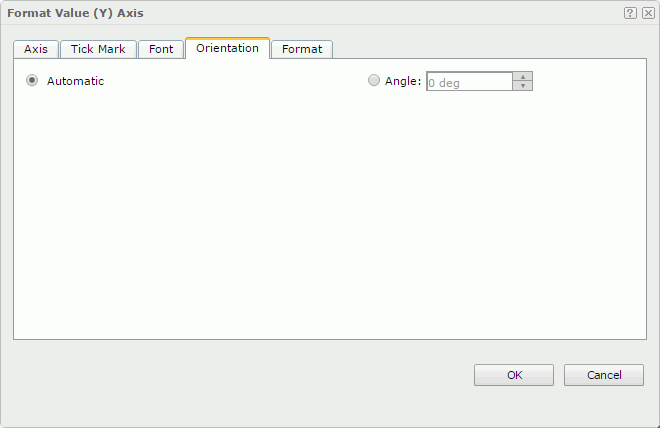
Automatic
Specifies whether to adjust the rotation angle of the label text on the axis automatically according to the length of the label text, in degrees.
- If the text can completely display horizontally, the default rotation angle will be 0.
- If the text cannot completely display horizontally, the default rotation angle will be 30 anticlockwise. Server displays an ellipsis (…) from the right side of the label, along with part of the name instead of the entire name.
Angle
Specifies to customize the rotation angle of the label text on the axis.
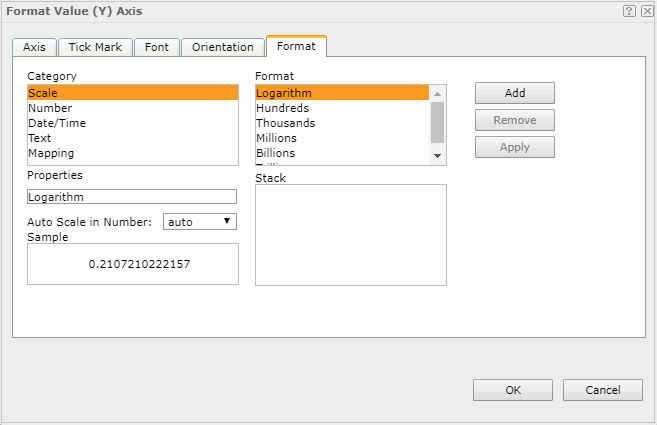
Format Tab Properties
Specifies the data format of the major tick mark labels on the axis. See Format.
 Previous Topic
 Back to top