 Previous Topic
Part I: Logi Report Overview
This part provides an overview of Logi Report. It contains the following topics:
Logi Report Product Overview
Logi Report delivers operational business intelligence to enterprise applications through powerful embedded reporting.
Logi Report is a complete Java reporting solution that provides sophisticated enterprise reporting, ad hoc reporting, and data analysis. A 100% Java EE architecture and a rich set of APIs enable Logi Report to be seamlessly embedded into any application, providing end users with a transparent interface to easily generate reports, share information, and analyze data. In Logi Report, you can make any report interactive, thus extend the "life" of a report by enabling users to easily sort, group, navigate, and filter via the Web. This wide range of functionality, including the ability to drill down on data, enables users to quickly derive value from their business intelligence.
Logi Report's architecture takes advantage of the portability, scalability, and ease of integration associated with Java EE technology to provide a powerful, flexible reporting solution that fits perfectly within any application architecture.
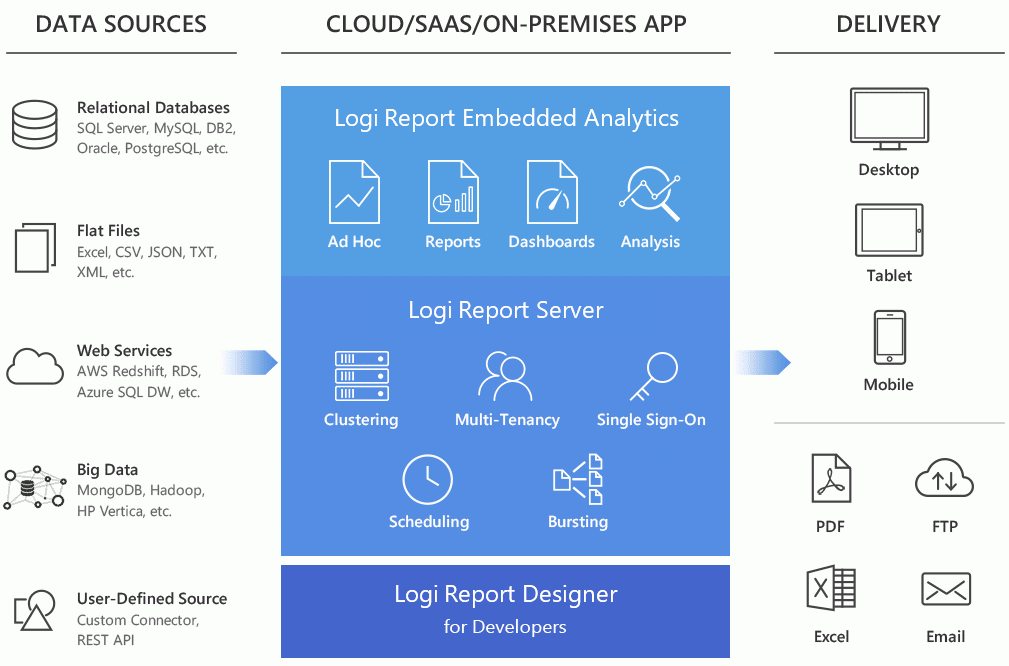
Logi Report Server is a high performance reporting engine designed to support embedded analytics for any application. It can scale from a single CPU to a cluster of servers for any deployment requirement on any system architecture. With a full set of Java and JavaScript APIs, Logi Report Server has been integrated into hundreds of applications and caters to hundreds of thousands of users every day. As a 100% Java report generation and management tool, Logi Report Server enables efficient management, sharing, scheduling, and delivery of reports. With Logi Report Server, any application can empower end users to create, navigate, and interact with their data visualizations.
Logi Report Designer is a Swing-based Integrated Development Environment (IDE) that enables sophisticated report design and presentation of critical business data. It provides an intuitive interface, reusable report components, flexible layout, and a toolset for designing and testing reports. With Logi Report Designer, you can build reports using simple drag-and-drop techniques or by using wizard; you can access data from any data source to design and preview reports in order to deliver information to end users in the most relevant and intuitive manner; you can accomplish rapid creation and modification of reports by toggling between design mode and view mode where the report displays with the actual dataset. Once report design is complete, you can publish the report to Logi Report Server for generation, delivery, and management.
To get more information about the Logi Report products, go to https://www.logianalytics.com/jreport/.
 Back to top
Who Uses Logi Report?
Logi Report delivers an enterprise-wide solution. Therefore different types of users throughout your organization can use Logi Report. Each type of user is able to understand the features and find value in Logi Report as it relates to their job function or reporting requirements.
There are five general types of Logi Report users. Each type of user can focus on specific areas of this tutorial as described below:
- Business Analyst
If you are a business analyst, you should understand how Logi Report Page Report Studio and Web Report Studio allow you to create a special category of reports called ad hoc reports. Unlike the predefined reports in Logi Report Designer, you build these reports in the runtime environment based on a data model built and published by a report developer.
You can also create a dashboard rather than a web report or page report, using predefined data components with JDashboard, or use the in-context analysis tool Visual Analysis to visualize the result of every step of your work.
Focus on tracks in Part IV: End User Experience.
- Developer and Report Developer
If you are a report developer, you use Logi Report Designer, Logi Report's visual design environment. This intuitive desktop design tool enables the building of data source connections to your database for retrieving data to reports and uses familiar conventions such as property panels, toolbars, style sheets, and drag-and-drop placement to support every aspect of the report design process. You can quickly become proficient in using the design environment and be able to create professional reports.
- Systems Analyst or Application Server Administrator
If you are a systems analyst or application server administrator, you should know that the Logi Report solution is managed from a single access point, a web-based console. The Logi Report solution offers many different deployment options, enabling existing architecture to be leveraged. It can be embedded in a web application via a self-contained WAR/EAR file to provide a reporting service or it can operate as a standalone server.
See Publishing, Running and Administering Resources in Part III.
- End User
If you are an end user of reports, you should understand the many different presentation strategies that are available. You can decide which format best delivers the information that you need to make timely and critical business decisions. In Logi Report, you can view and export reports to a variety of formats including HTML, PDF, Excel, XML, RTF, CSV, PostScript, Page Report Result, and Web Report Result. Logi Report's Page Report Result and Web Report Result outputs enable you to interact with and customize report views to obtain exactly the information needed.
Focus on tracks in Part IV: End User Experience.
What Is a Report?
A report is comprised of a report template and a dataset.
A report template contains static text, graphics, and placeholders for data.
When a report is in the runtime environment, it connects to the data source associated with the report, executes the query, and applies the fetched data to the template thereby creating a report result file:
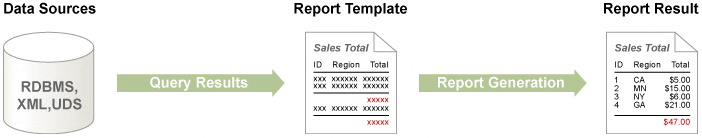
Therefore, each report result represents a unique dataset, the one that exists at the time the query runs.
Lifecycle of a Report
Just like an application, a report has a distinct life cycle. The life cycle contains the following phases:

Phase 1: Determine requirements (report developer)
The first fundamental requirement comes from the intended end users of the report. First, determine who are the end users of the report and then identify the general purpose of the report. Ask what decisions those users need to make and how often they need to make them (daily, monthly, or other).
Second, you should determine the specific pieces of data that need to be presented in the report and how the pieces map to the data source. Look for common data elements that span multiple reports.
Third, you need to determine the security implications associated with the report. Are there pieces of data that need restricted access? Are there regulatory drivers of the report?
Fourth, determine the expected demand of the report result. Are on-demand report results necessary or can the report be scheduled? Do the report results need to be saved, and for how long?
Fifth, determine the desired report output format. For most Java applications delivery, via the Web is the preferred method to present information. However, there may be other end users who don't need or want Web-based information. Perhaps they require the report be delivered in a standard business format (such as Excel or PDF) or printed.
Phase 2: Develop report template (report developer)
A template is a report blueprint that contains static text, graphical objects, and placeholders to display the data pieces needed on the report. The template definition includes the query that needs to execute to provide the data, and the database connection on which to execute it.
Share a report prototype that includes sample data with the end users to see if it meets their requirements and also to obtain feedback on the scope and layout of the report.
Phase 3: Publish report results (system administrator)
Publishing a report template executes the query and merges the resulting dataset with the template. The result is a report instance that is available in the context of Logi Report Server. You can save the report results to other locations, and in various formats such as HTML, PDF, RTF, and others.
Communicate with the end users regarding how they can access the report and then provide training, as needed. Include a way for the end users to provide feedback; acknowledge feedback and build release schedule.
As report production scales up, the system administrator should monitor performance and apply the appropriate load balancing and security measures.
Phase 4: Access report results (end user and business analyst) and administer (system administrator)
After a report is generated, end users can access it in a variety of ways. They can view the report through the Logi Report Server Console, through a Java application, or route it to a delivery target such as an email address or printer. The business analyst can also build ad hoc reports as needed.
The system administer monitors the report access environment through the Logi Report Server Monitor.
Phase 5: Update report template (report developer)
Collect feedback from the end users to determine any needed improvements to the layout or behavior of the report. Also, modify security as needed (add/drop users) and update data source connections.